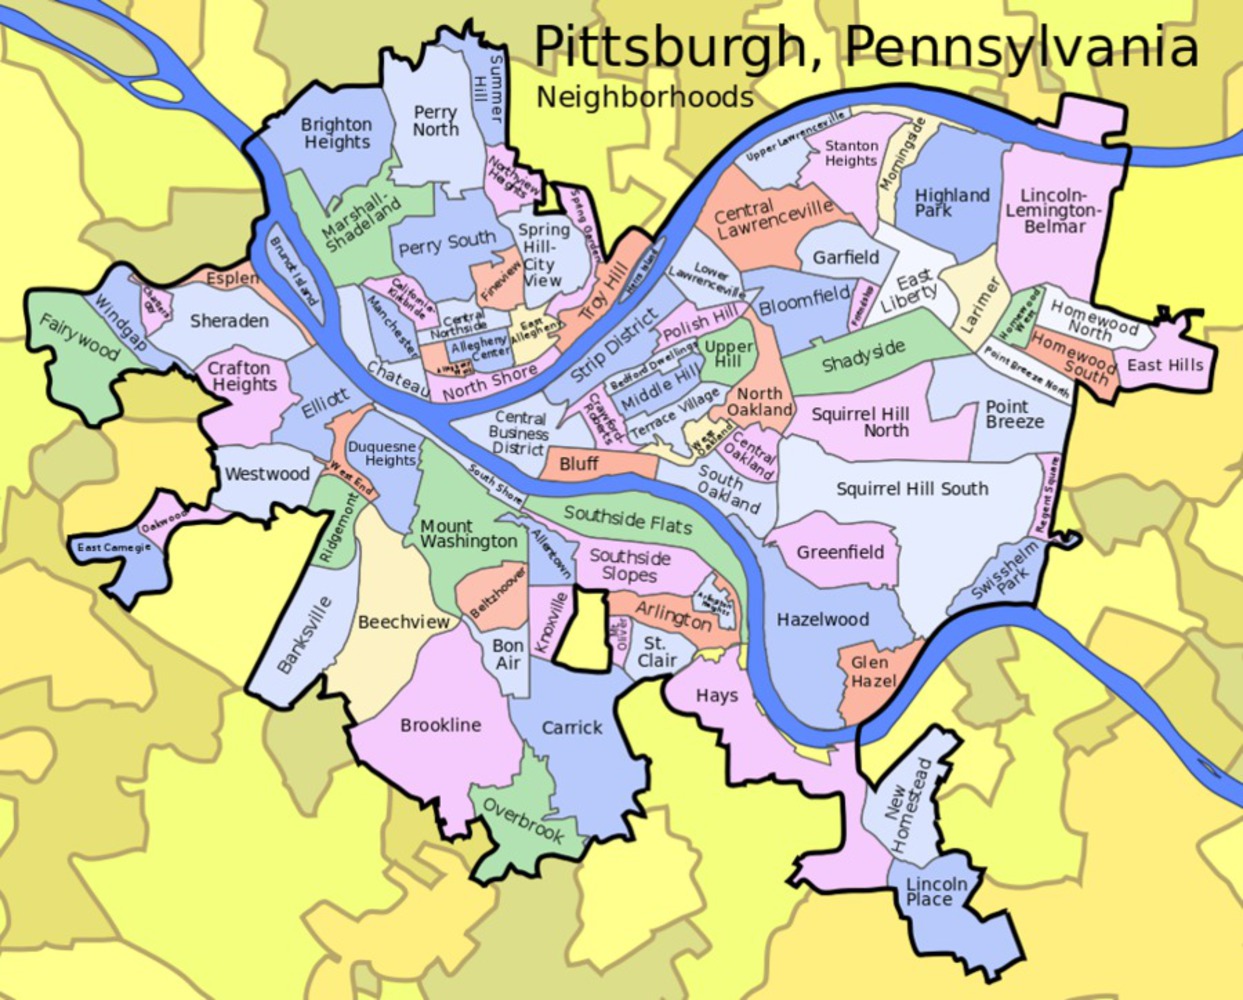
Pittsburgh: Potential areas for setting up an Office Space
Made by adobriya
Made by adobriya
Created: October 29th, 2017
What if an Entrepreneur (Say me) and wanted to set up a small working space in Pittsburgh for a startup? As its a small firm, employees would have to use outside resources for food and places to hang out during breaks. What would be a good location for me to set up my office? I try to find this out by looking at the following data.
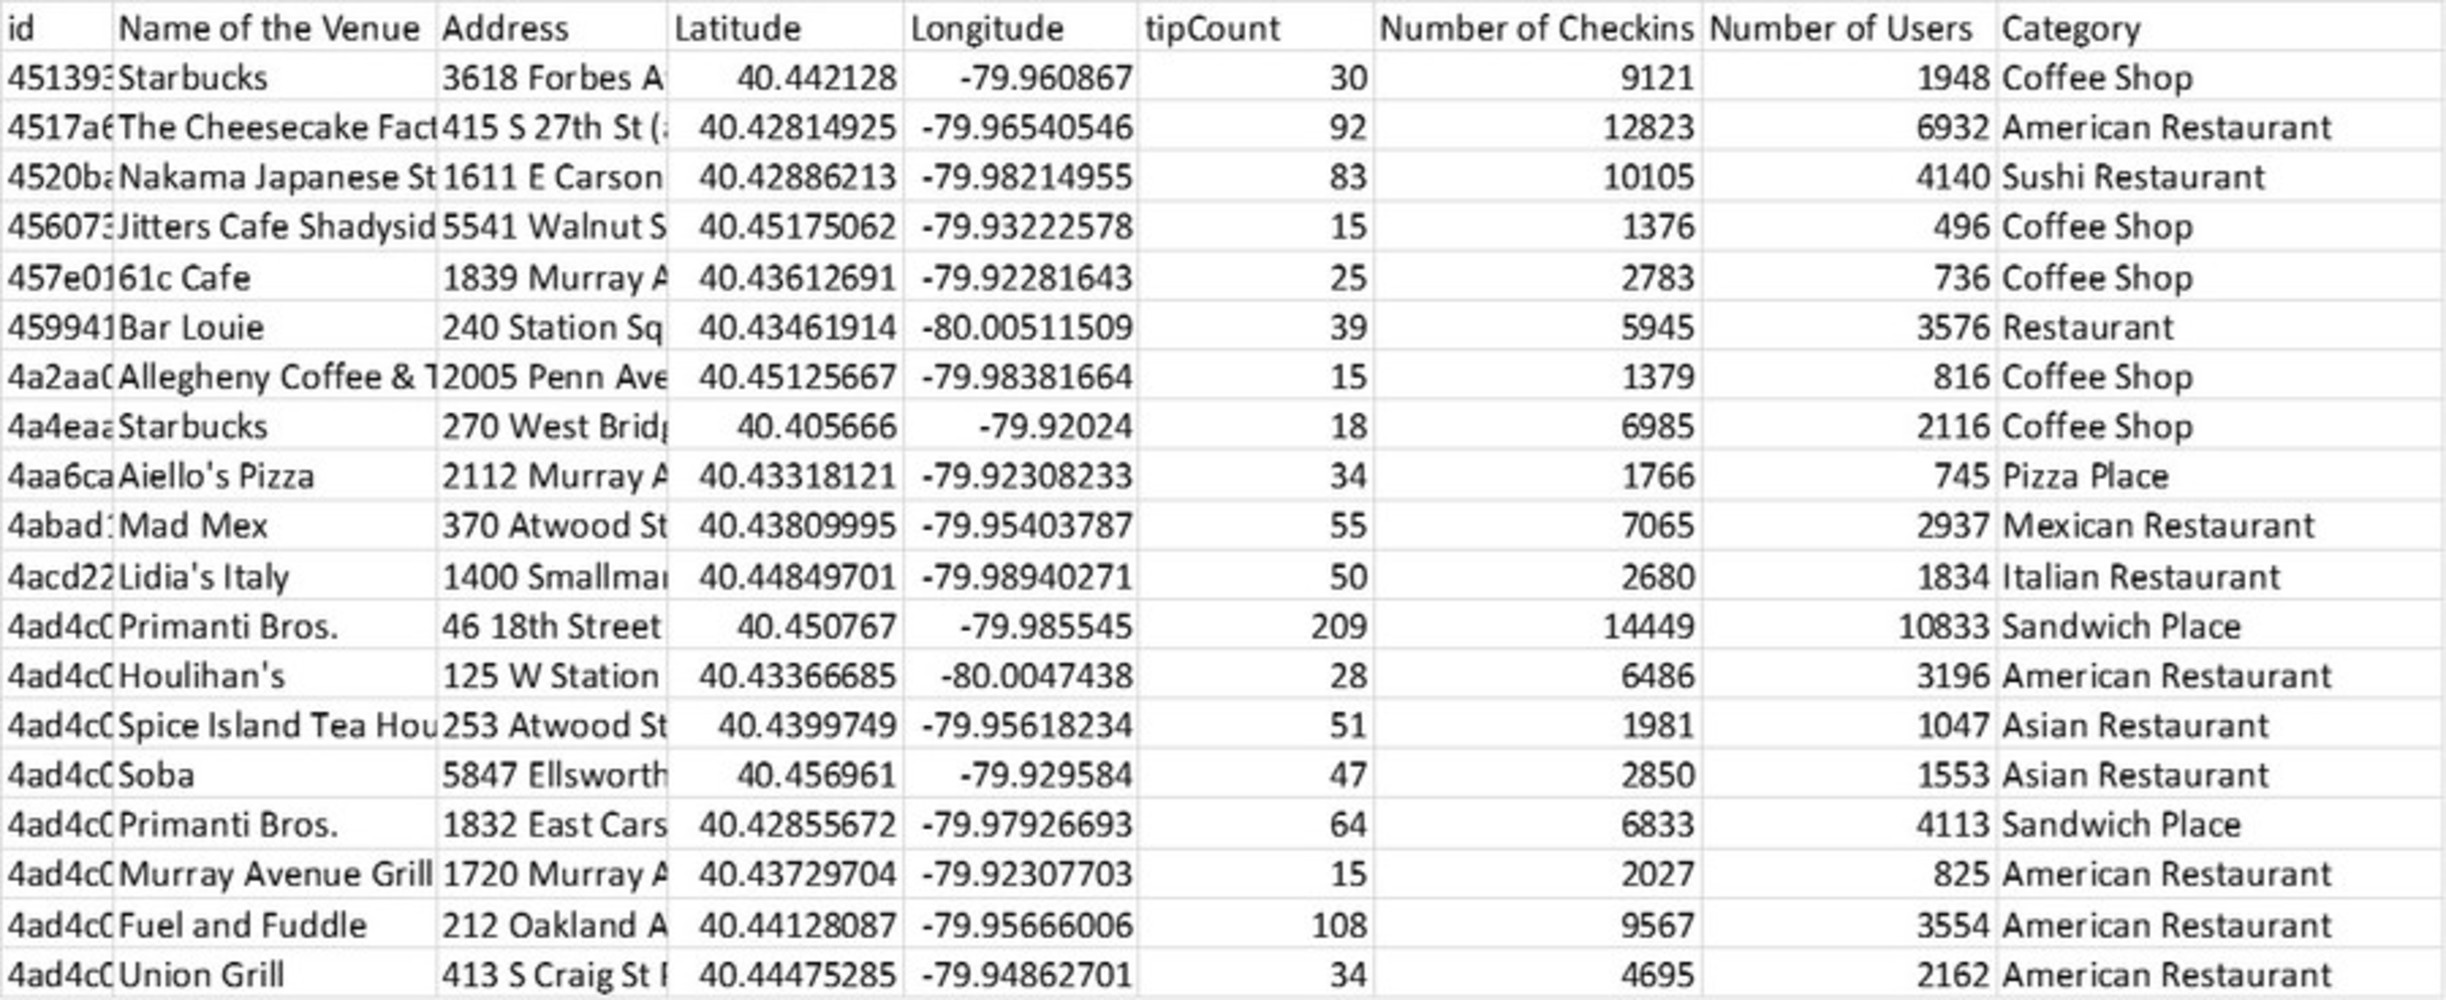
Four Square data for Pittsburgh, listing places to shop and restaurants with ratings, check-ins. Foursquare also points out trends and this could be a tool as well. Twitter data about how people feel about a certain place or what are their 'moods' when they are at a certain place would also help determine a balanced choice.
Using the data about restaurants and shopping from Foursquare, hotspots would be created at locations around the city and a list could be generated of possible spots for the office space. Based on walkability to amenities, a preference list would be created for the top 6 picks (1st, 2nd, etc.). Twitter data can be used to verify and validate this information as twitter users are known to be direct and unbiased. This data, when combined with property cost data from earlier research could then be used to find a perfect balance between utility & costs and choose a suitable location.
It is very important to look at the availability of offices and their accessibility. Also, Setting up a new office would mean that the employees will have to rely on outdoor amenities for food and leisure and hence these were looked into. Other factors such as shopping and recreation were also considered as employees would prefer is they could use these once they are done with office and their proximity would definitely help.
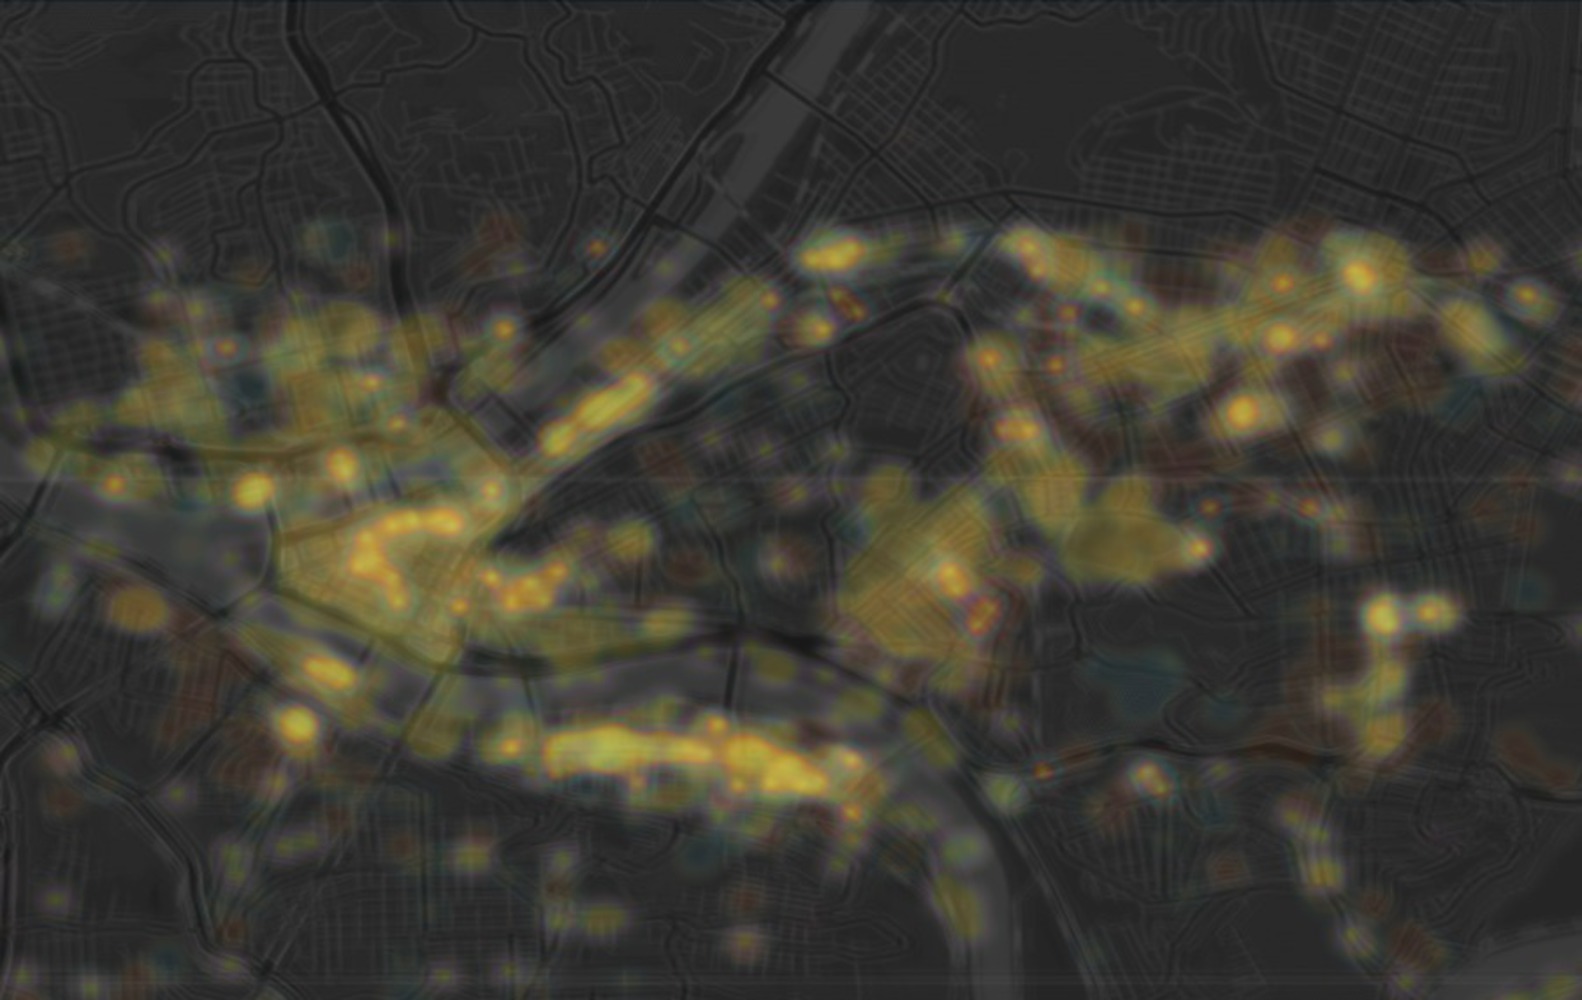
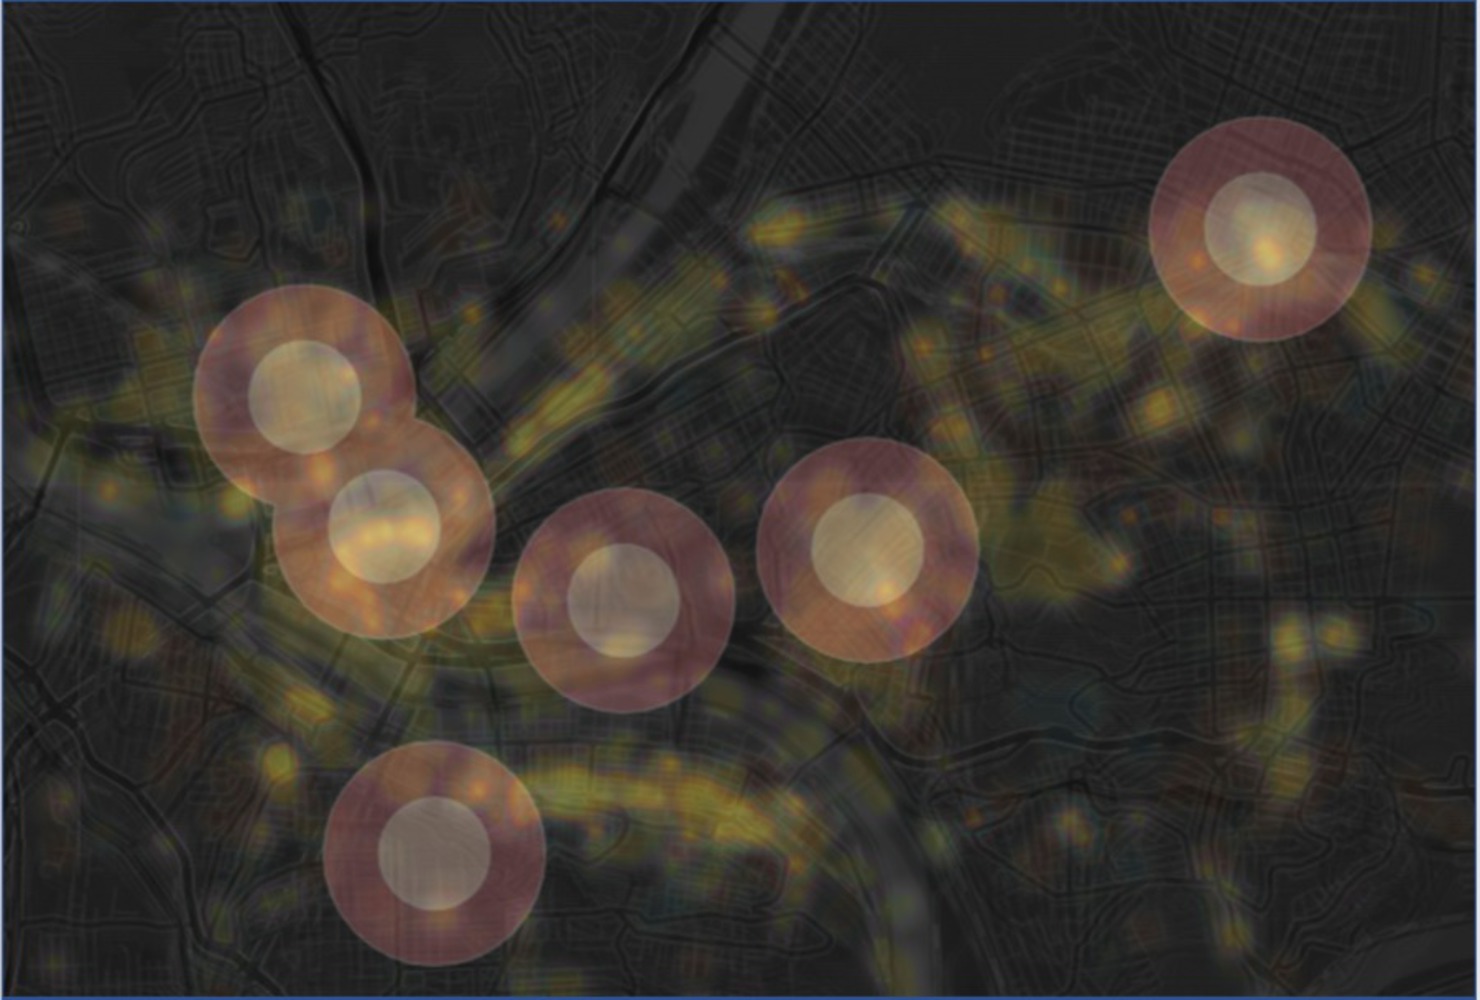
Overlapping these maps gave a bigger picture combining all the considerations and hence added value to the analysis by the virtue of ‘A whole is greater than the sum of its parts’. A walk-able service area seemed to be a good tool to gauge the distances highlighted by the overlapping hotspots.
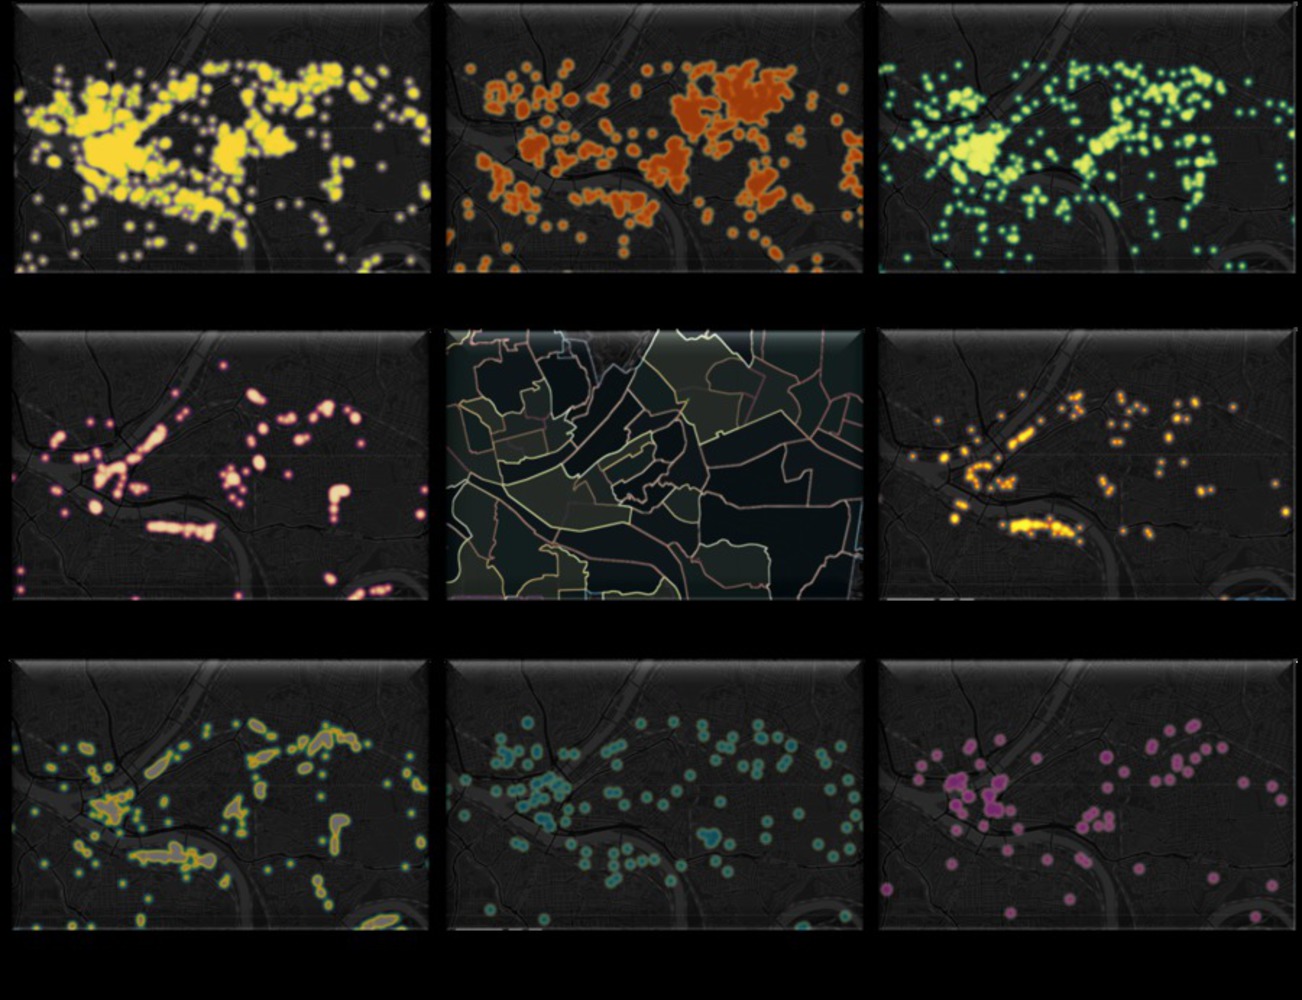
An overlay map was prepared by overlapping each of the following layers on the map of Pittsburgh in the form of hotspots:
Each of these datasets was filtered based on the above said contents and imported as a new csv into carto as a separate layer. Each of this layer was made transparent and then overlapped to create a combined hotspot map. This map was then used to draw service areas of 0.5 mile radius from the chosen spaces.
Aspect of Focus: Amenities within 0.5 mile (roughly 5 minute walk) radius
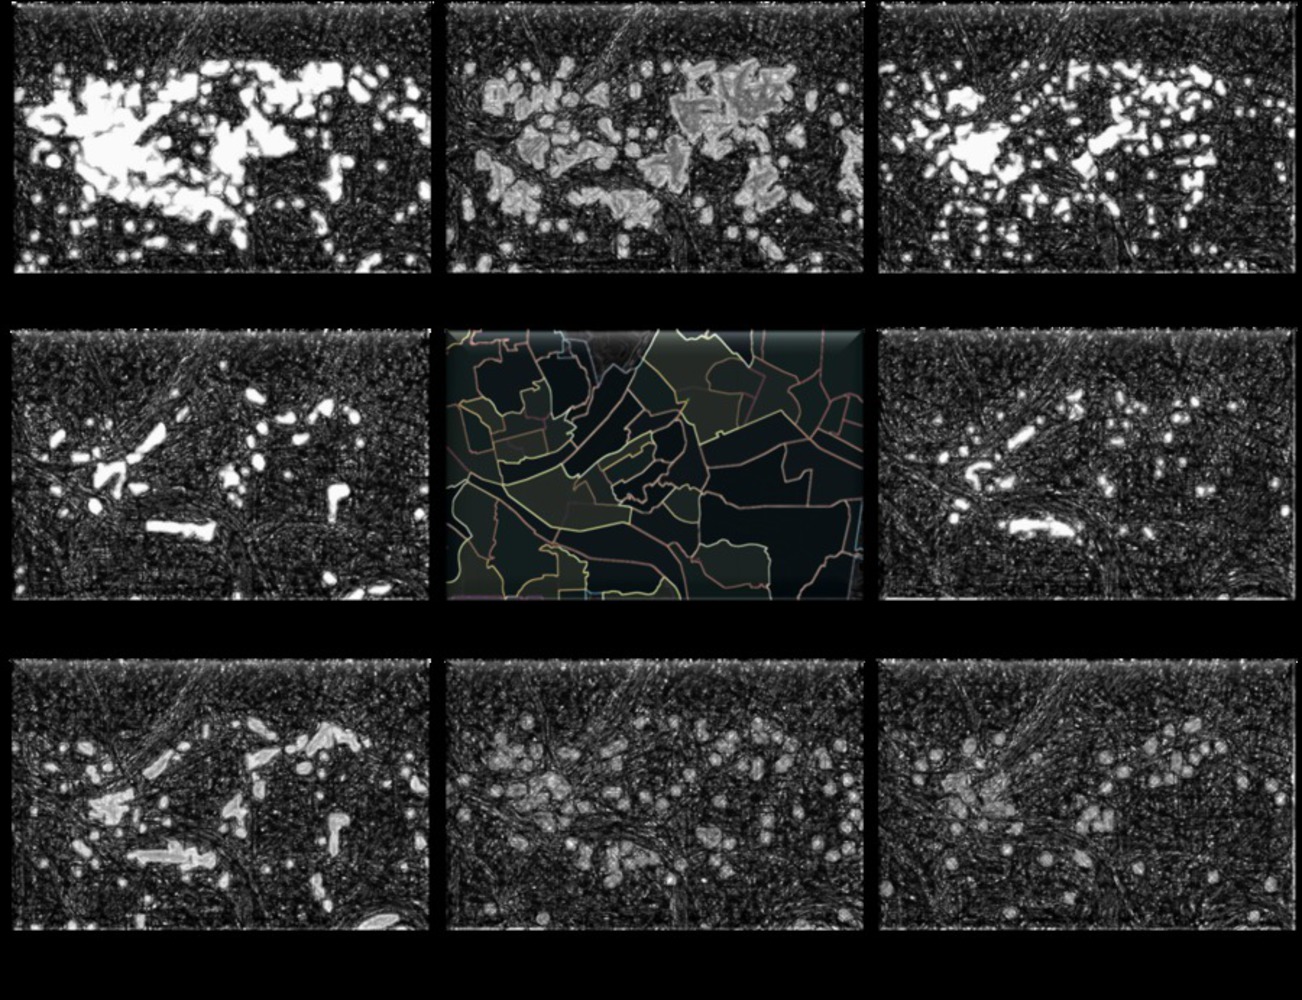
The next slide shows a sample screenshot of the data set used for the layer 'Food'. The following two slides show the different layers to be overlapped. The graphic is recreated in black and white to show contrast and highlight the hotspots.
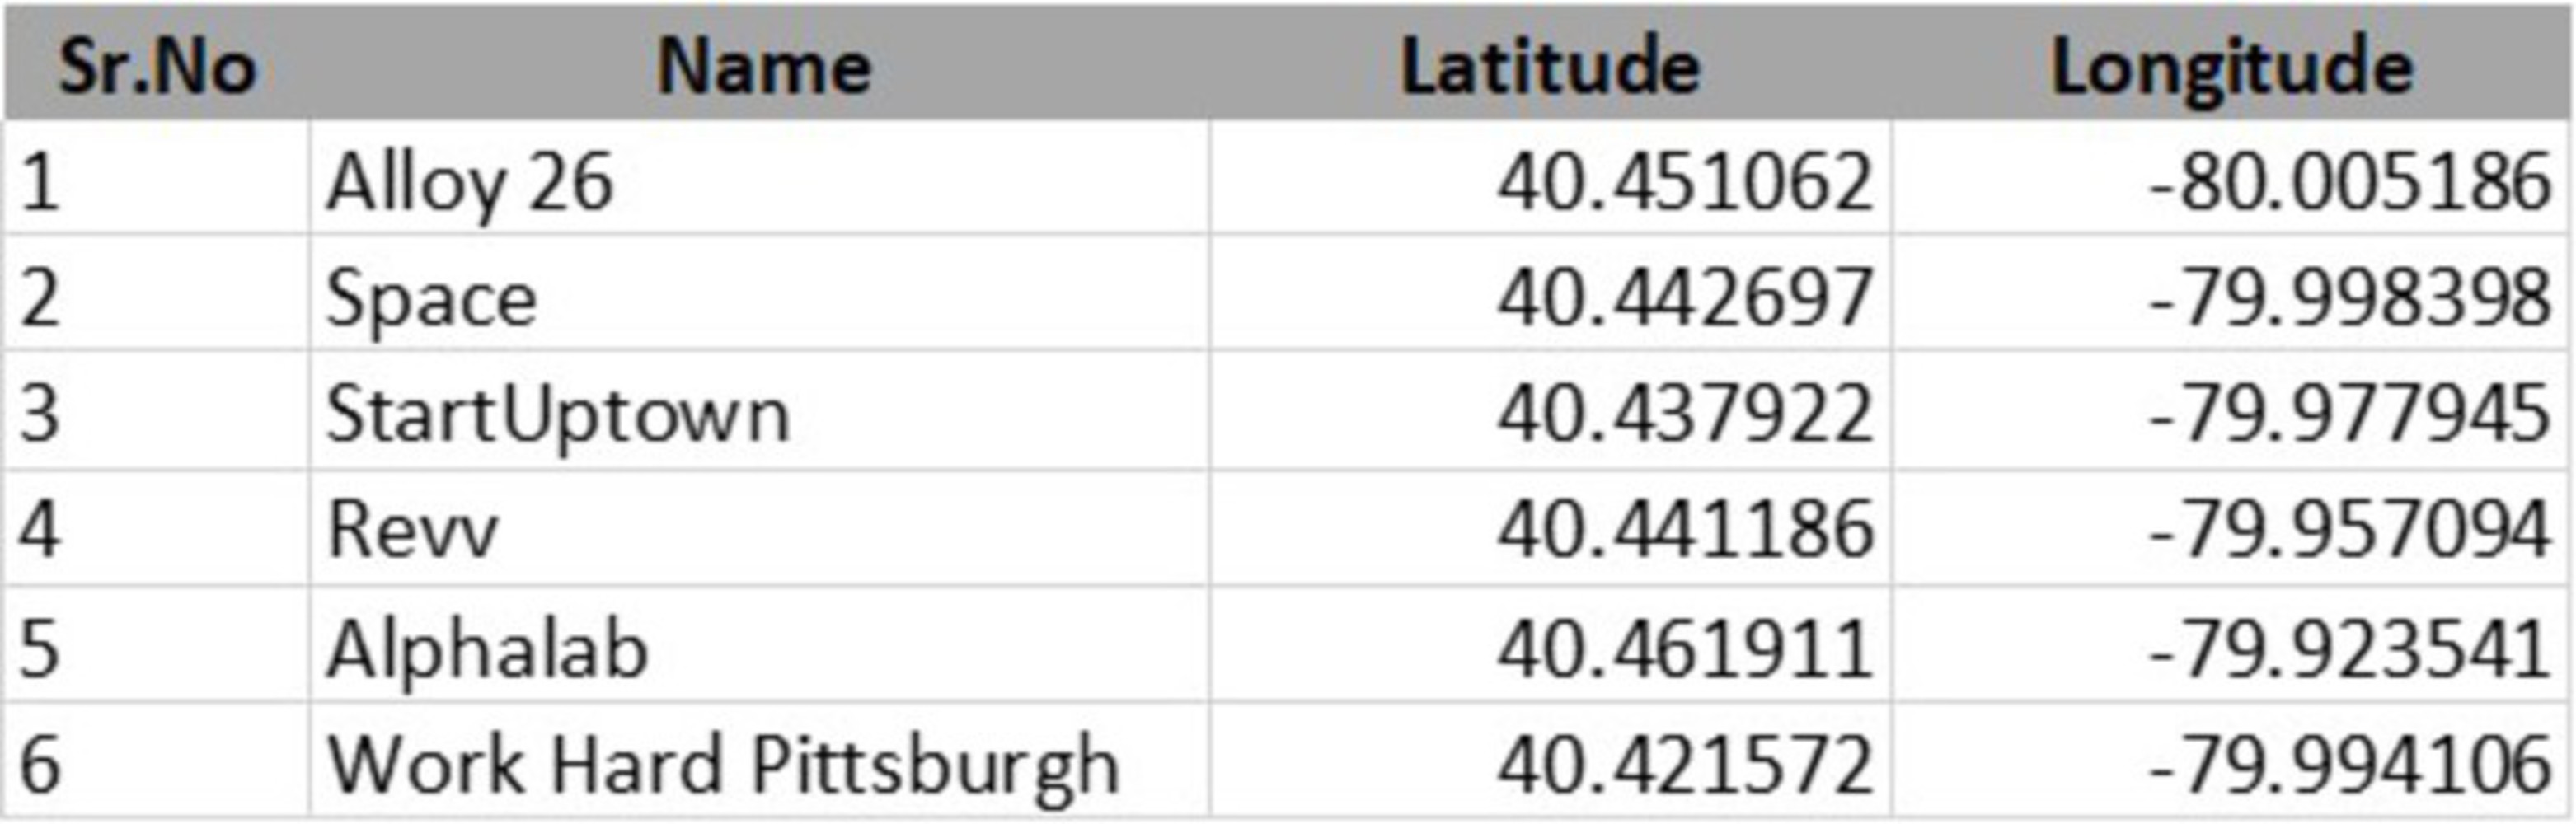
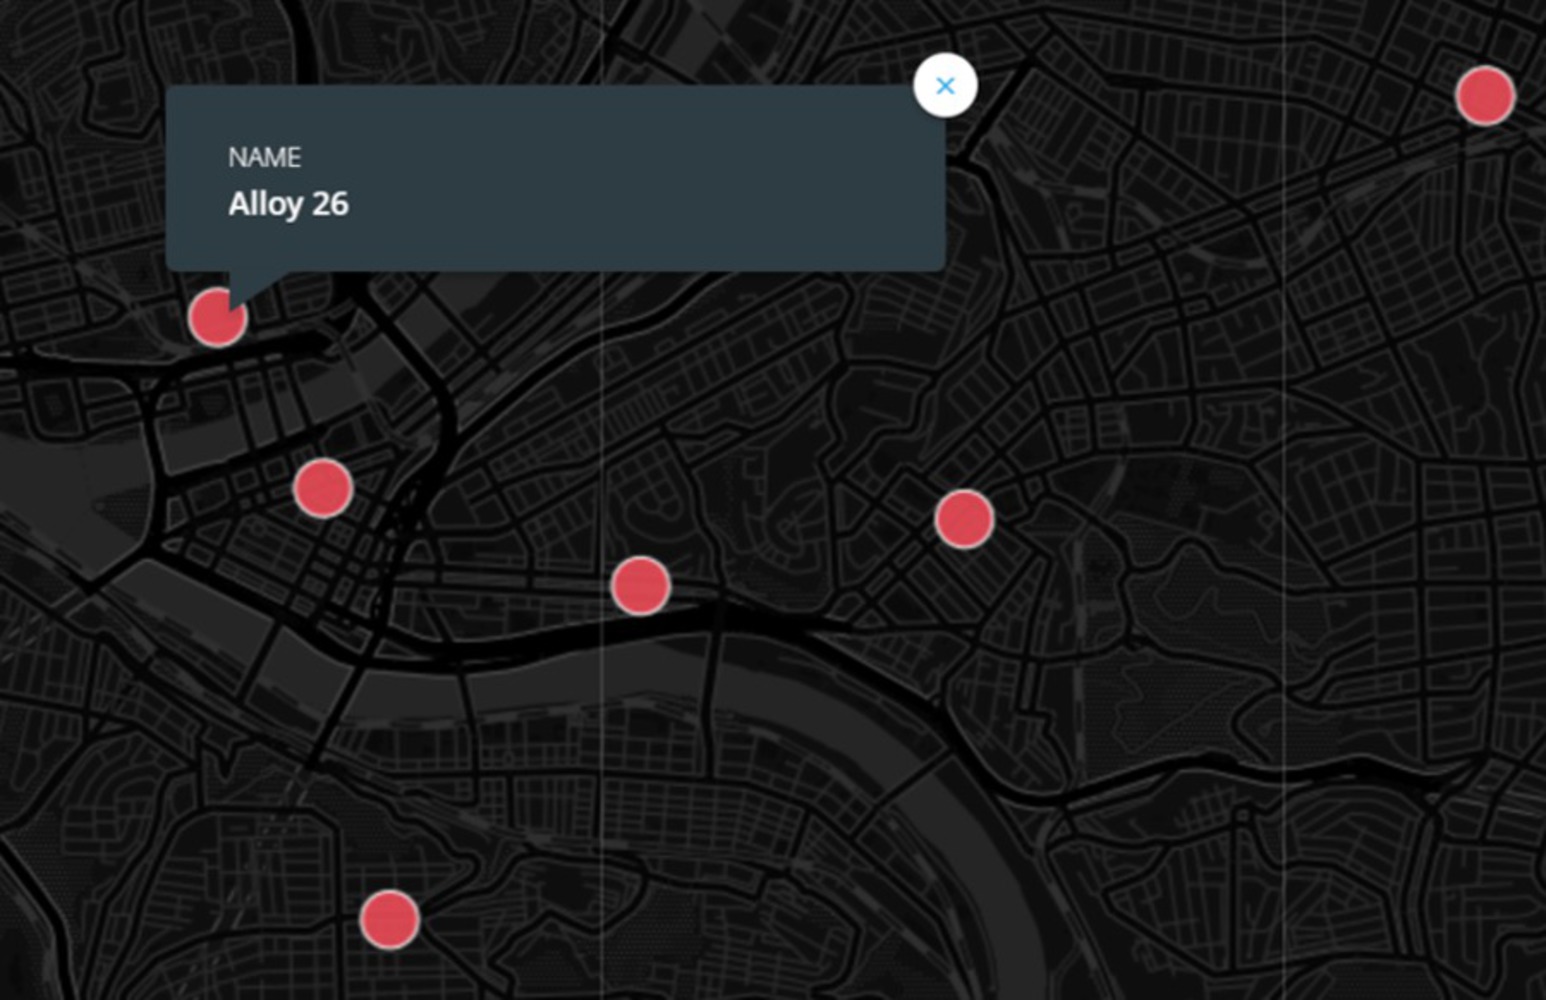
These empirically chosen locations were then used to identify Co-work office spaces in each of these areas. Only locations with a minimum of two co-work spaces were chosen. These spaces would be used as reference points to map the 0.5 mile service area onto the visual using carto.
The spaces chosen were:
These were then georeferenced and the dataset was added to carto to produce a map as shown above.
Using layer analysis ‘ Create Areas of Influence’ , service area of 0.5 mile outer radius was created and the following slide shows these service areas overlapped onto the illustration created earlier.
As per the above illustration, the areas in order of preference are:
This puts us a step ahead in deciding on a place for the office. However, certain other things scan be done to validate our choices even further.
Top 5 adjectives within tweets from the areas shortlisted in the previous section:
The most common adjective across these zip codes is ‘great’ followed by ‘good’. There is not one negative sounding adjective in the top five across these areas. However, one might make a case for ‘hot’ being a negative word but it does not convey any common sentiments.
As can be seen from the data above, there seems to be no adjectives pointing at detrimental or negative sentiment in any of the six neighborhoods chosen. Hence, there isn’t a need to eliminate any of the chosen areas based on this data. This data validates to some extent the analysis performed in the previous sections from the point of view of Twitter, where people do not shy away from expressing their feelings and emotions.