Quality of Social Life Comparison in Wilkinsburg, Hazelwood and Homewood
Made by Lu Zhu
Made by Lu Zhu
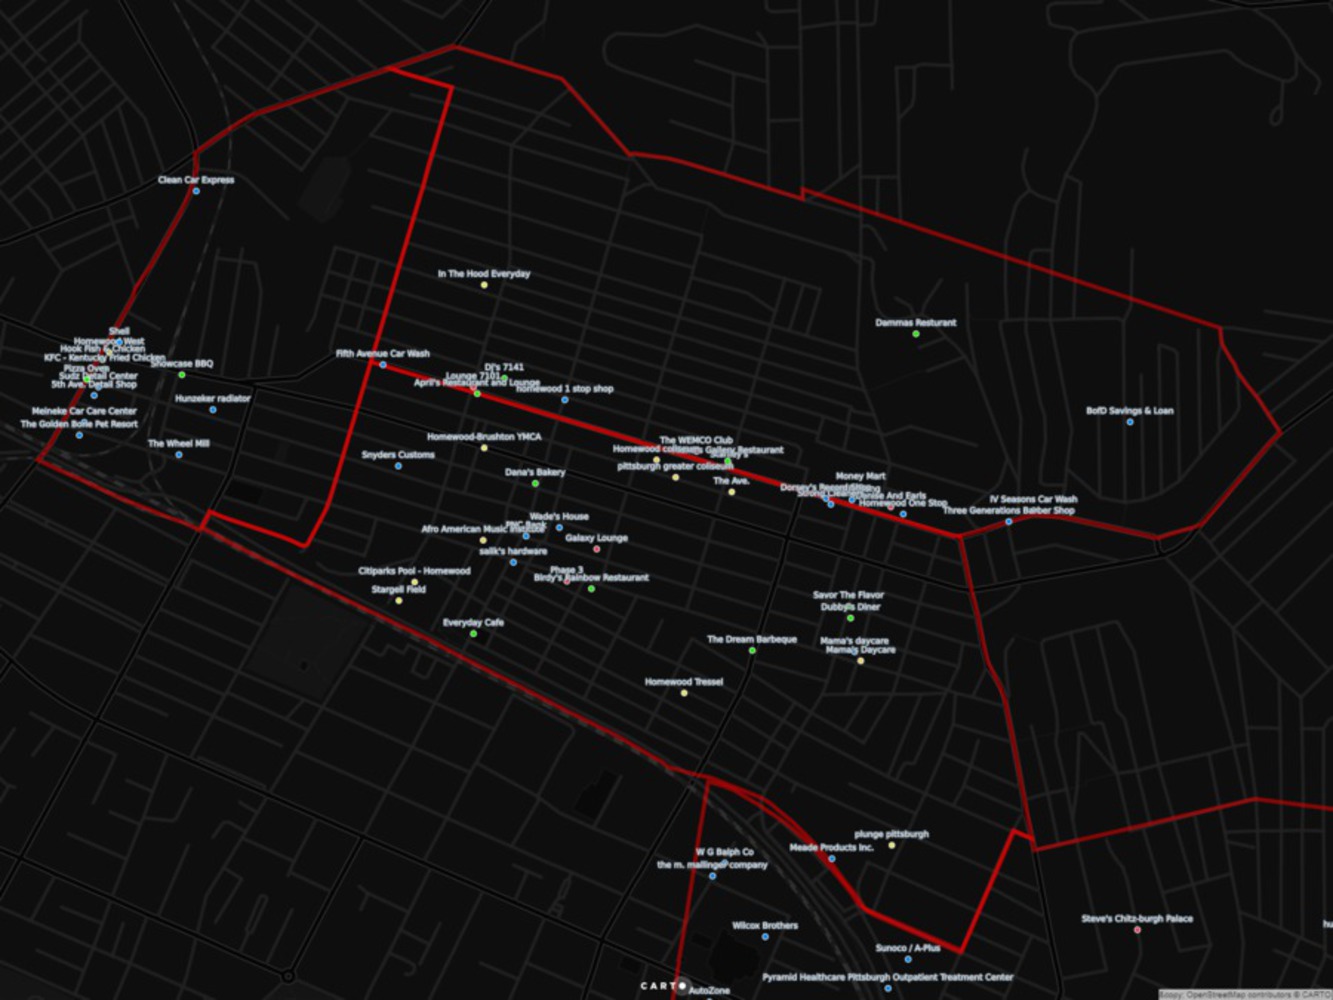
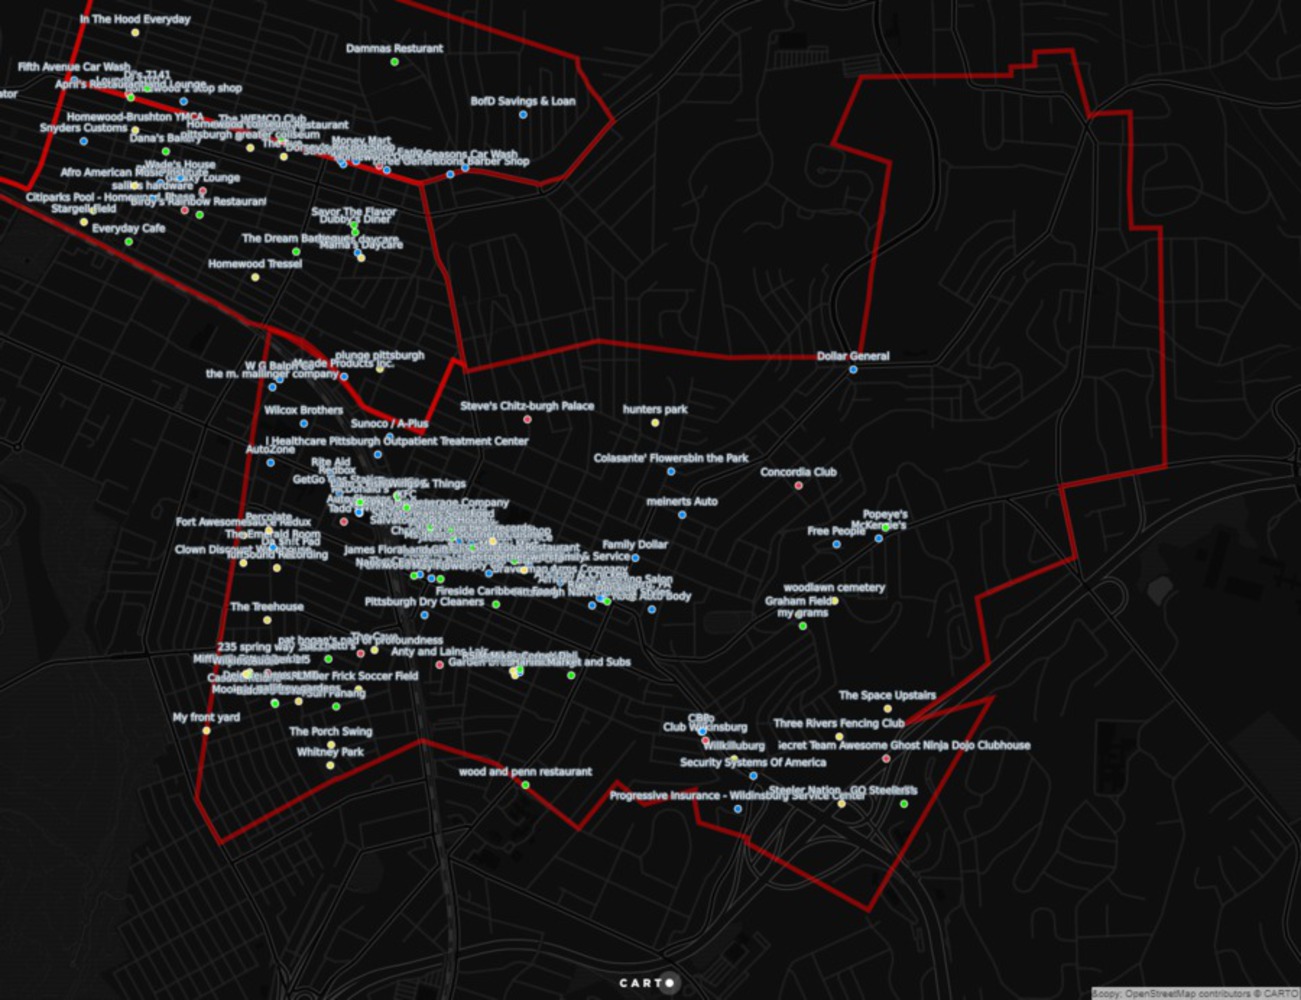
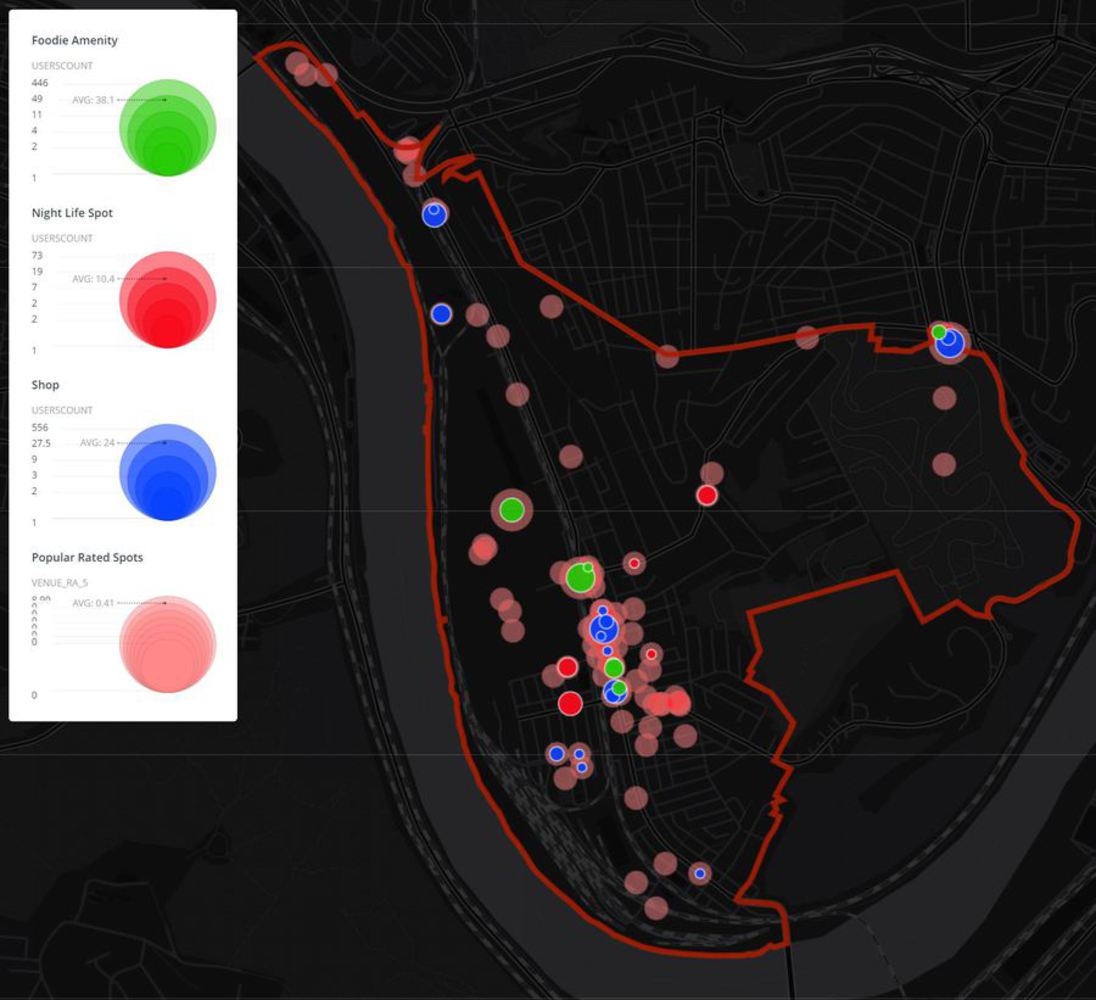
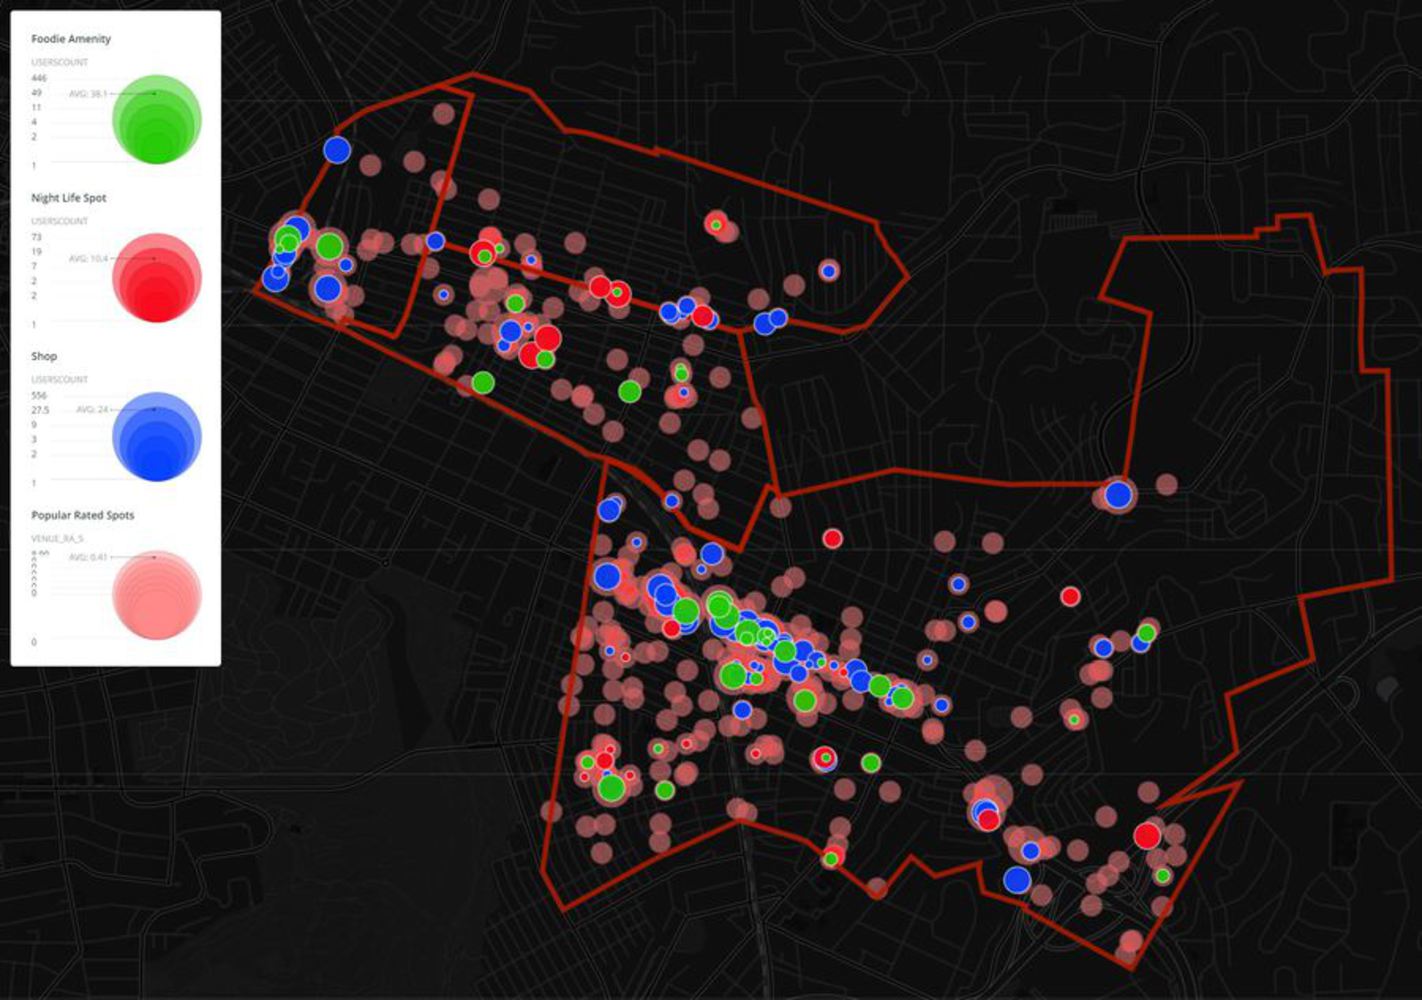
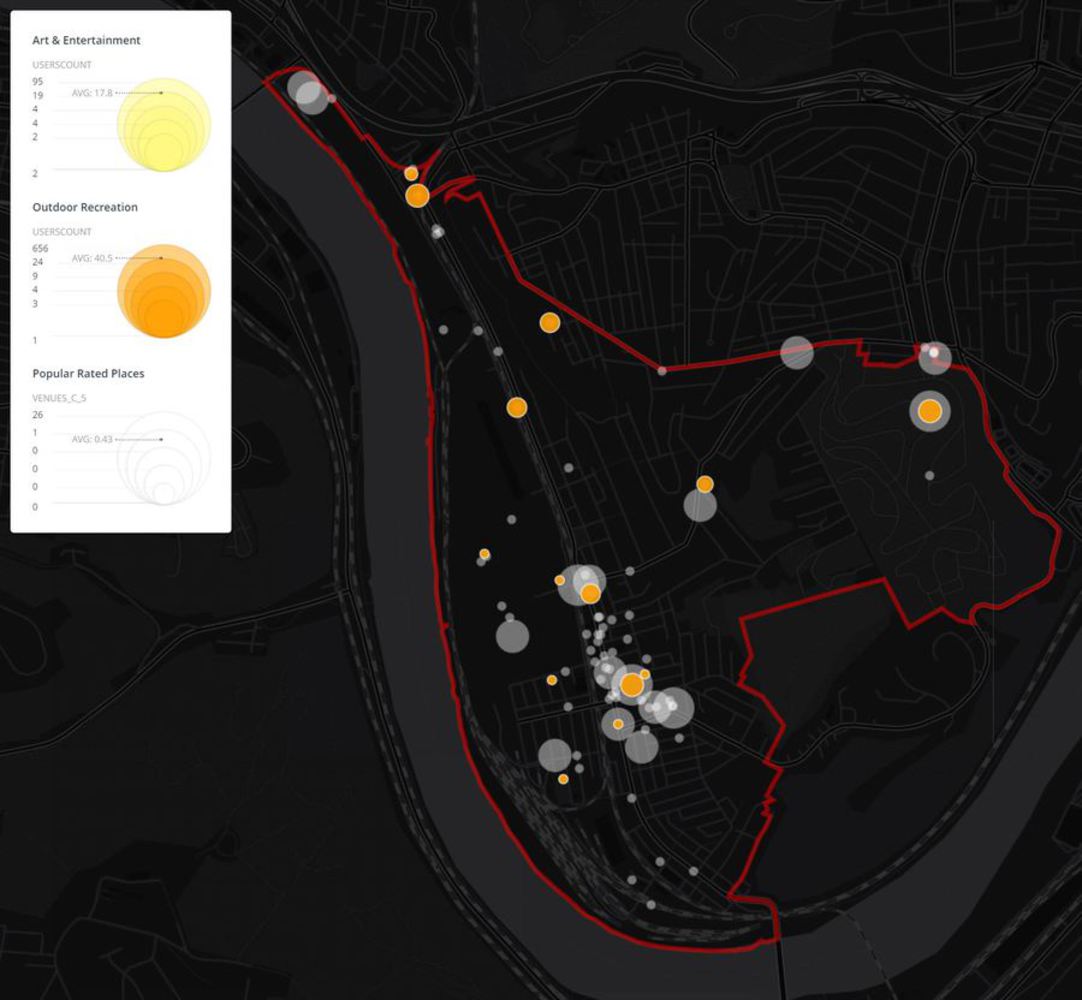
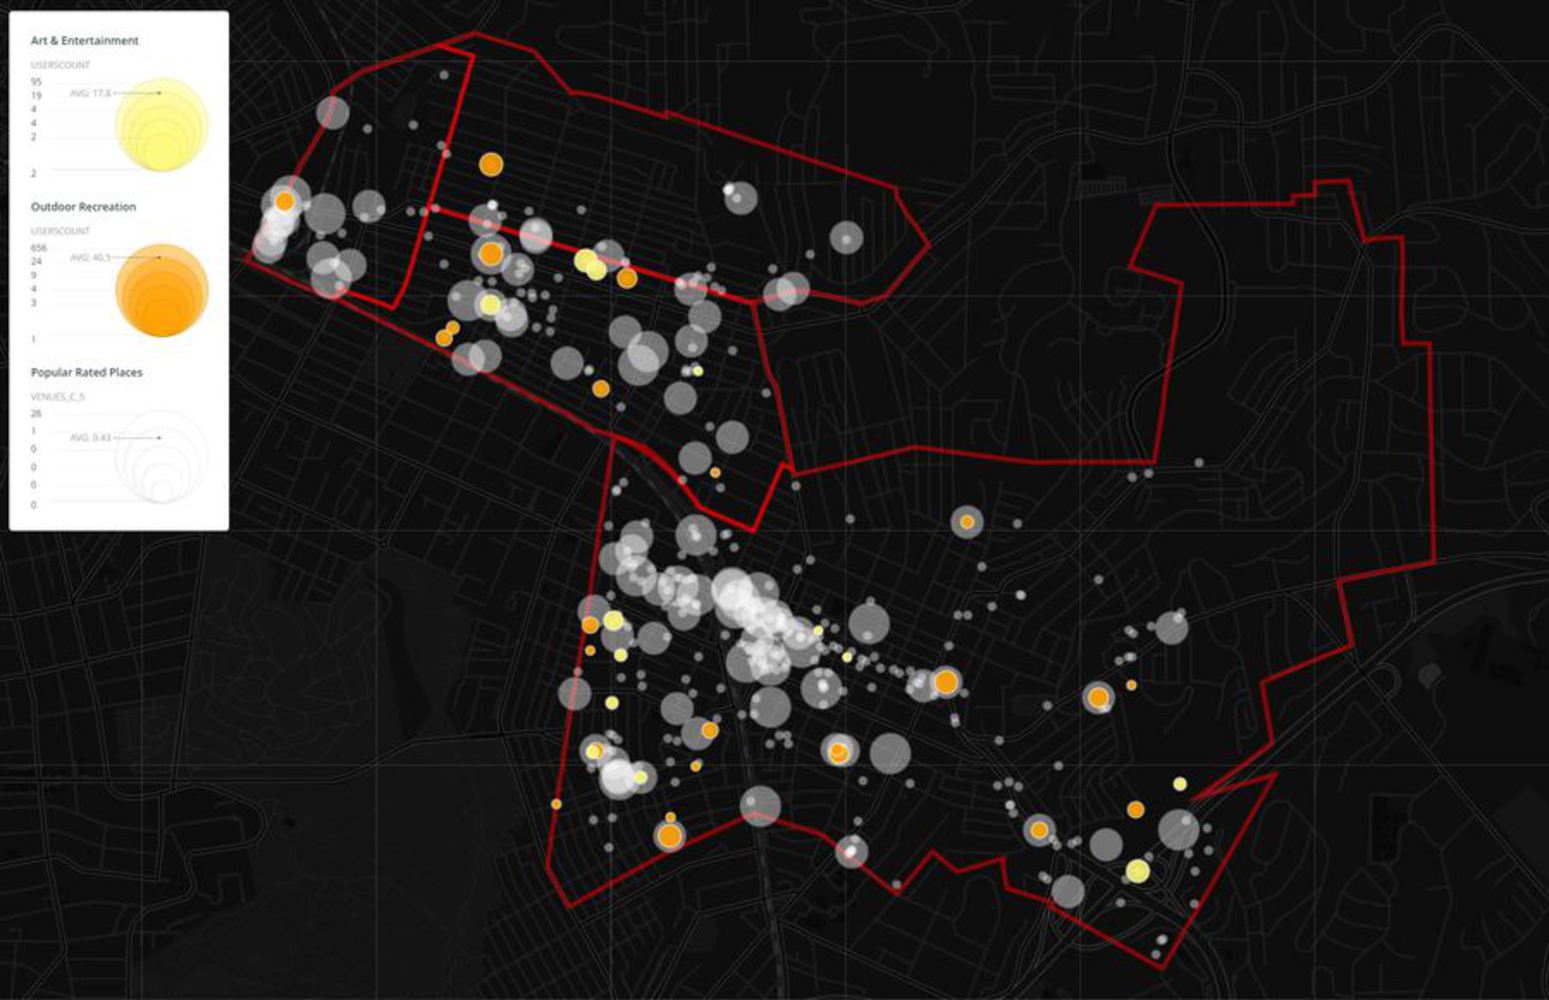
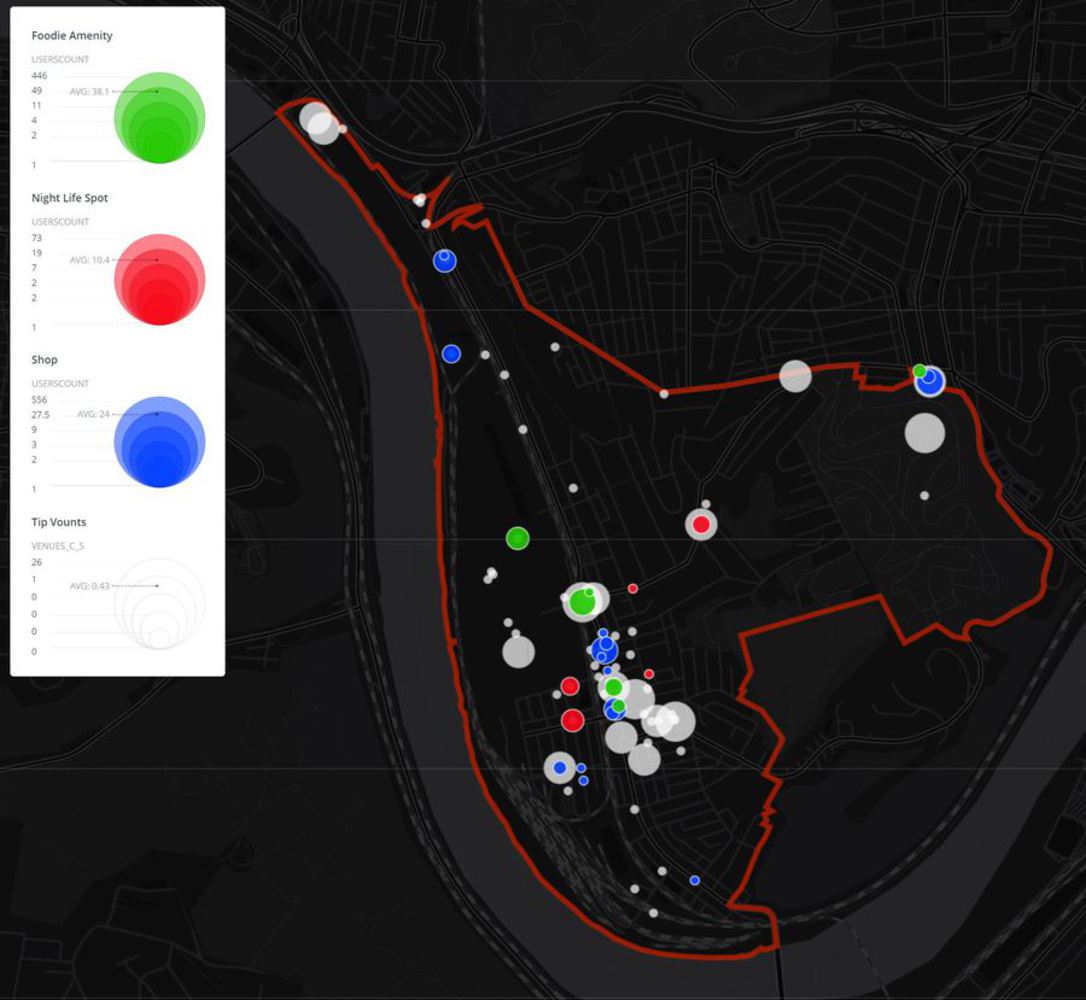
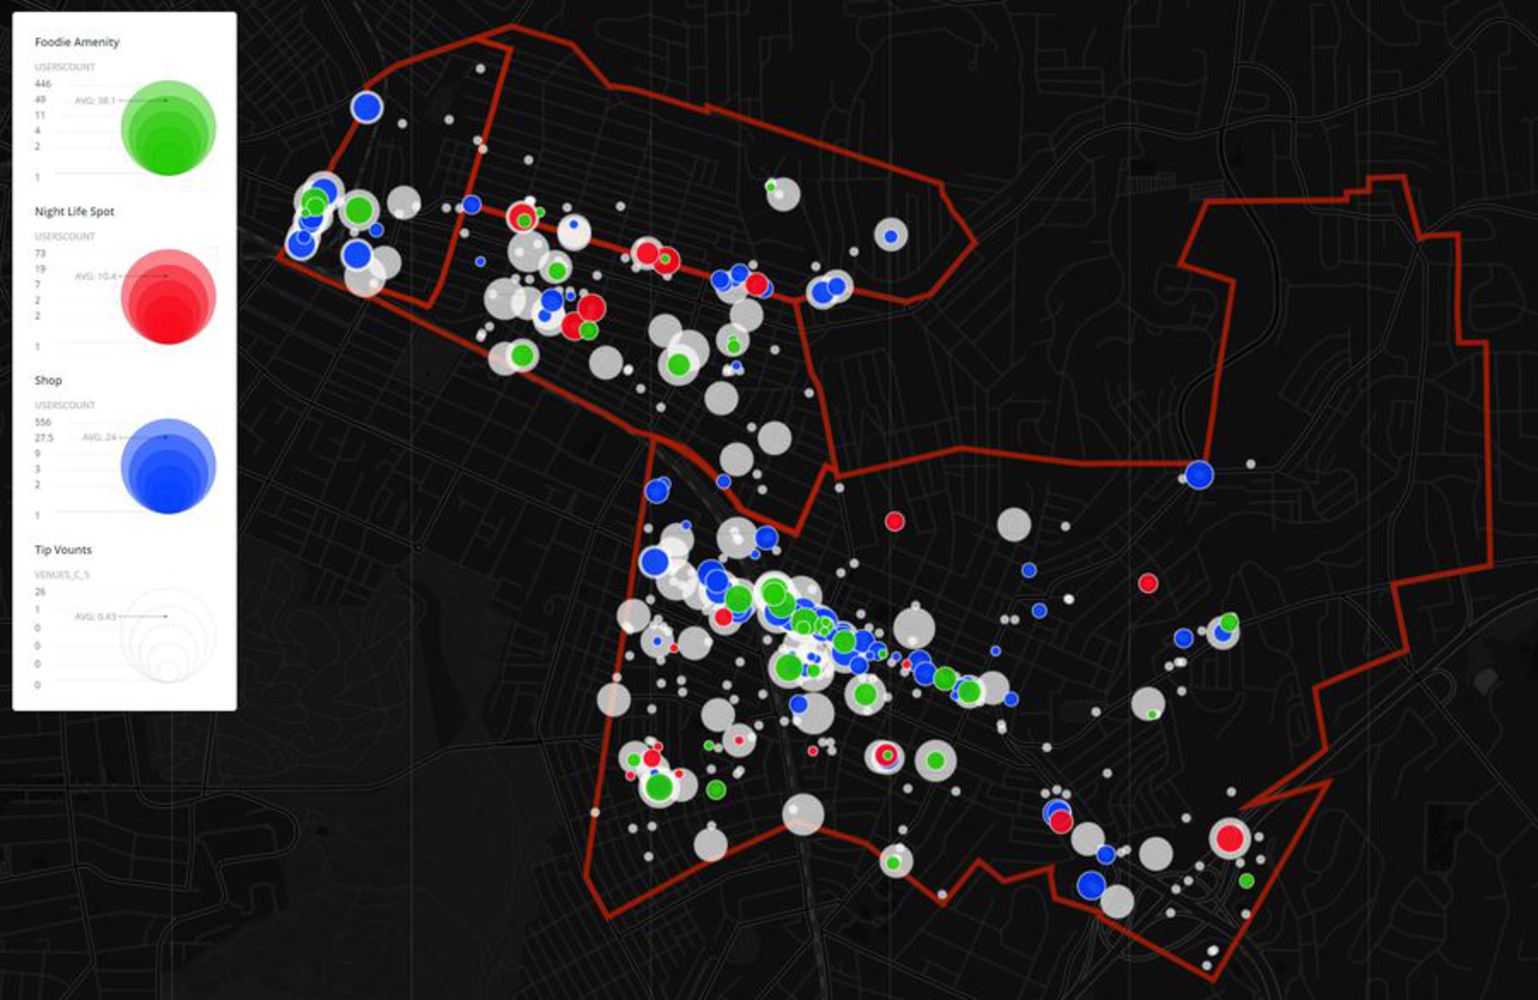
The project is using social media data to analysis the quality of social life in three Pittsburgh neighborhoods, where are perceived as lacking of social life. The analysis will focus on three criteria to measure the quality of social life, including accessibility to culture and recreational amenities, intensity of usage in average amount of time, and social connections in the neighborhoods. The visualization will also follow the three measure to see the social activities generated at the sites.
Created: October 27th, 2017
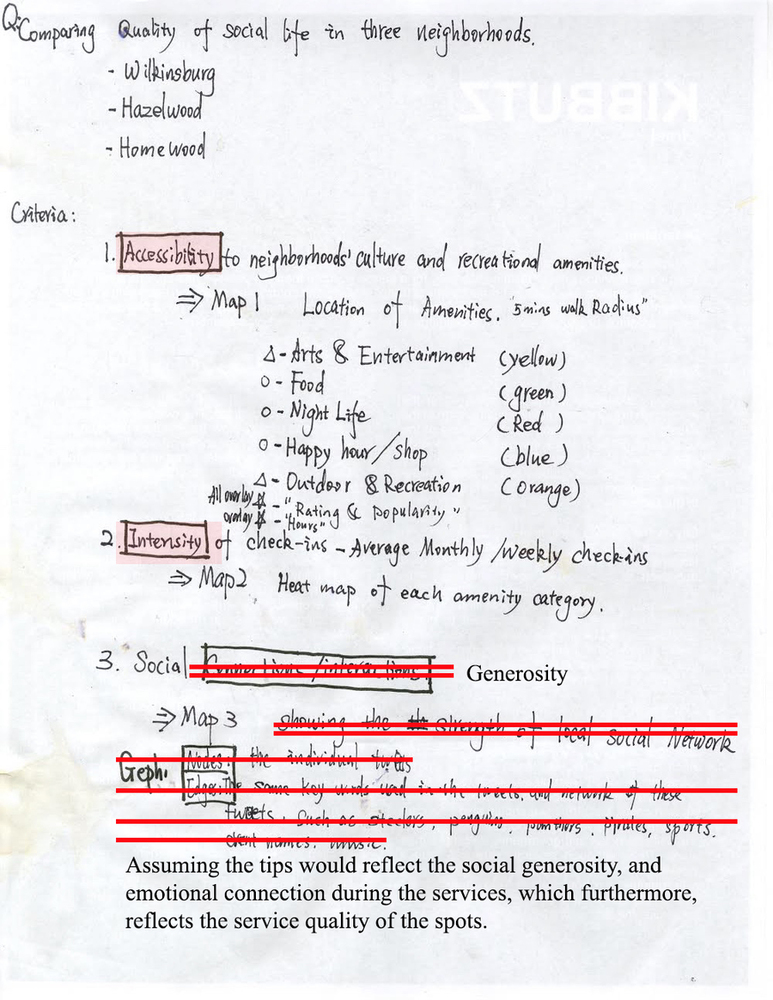
The project is using social media data to analysis the quality of social life in three Pittsburgh neighborhoods, where are perceived as lacking of social life. The analysis will focus on three criteria to measure the quality of social life, including accessibility to culture and recreational amenities, intensity of usage in average amount of time, and social connections in the neighborhoods. The visualization will also follow the three measure to see the social activities generated at the sites.