Real Estate Topographic Map
Made by Shaan
Made by Shaan
For this assignment, I tried to provide a visual representation of real estate values in Pittsburgh by using a topographic map that assigned height values to areas with higher or lower property values.
Created: May 22nd, 2017
Goal:
The goal of my project was to have a topographic map that depicted real estate values, making it easier to visualize data.
Process:
The process was long, and still I have not been able to accomplish the above goal completely.
At first, the plan was to use Trulia's data and convert that into a topographic map. Trulia.com provided data for each region in Pittsburgh (Average of 4000 square feet^2) and even a map of the specified regions. Making that into a topographic map could have been done very easily using the smooth shader options on Blender which is why I decided to go the other more detailed route. I wanted to have a more accurate topographic map that wouldn't look blockish like Trulia using specific home prices rather than macro region ones.
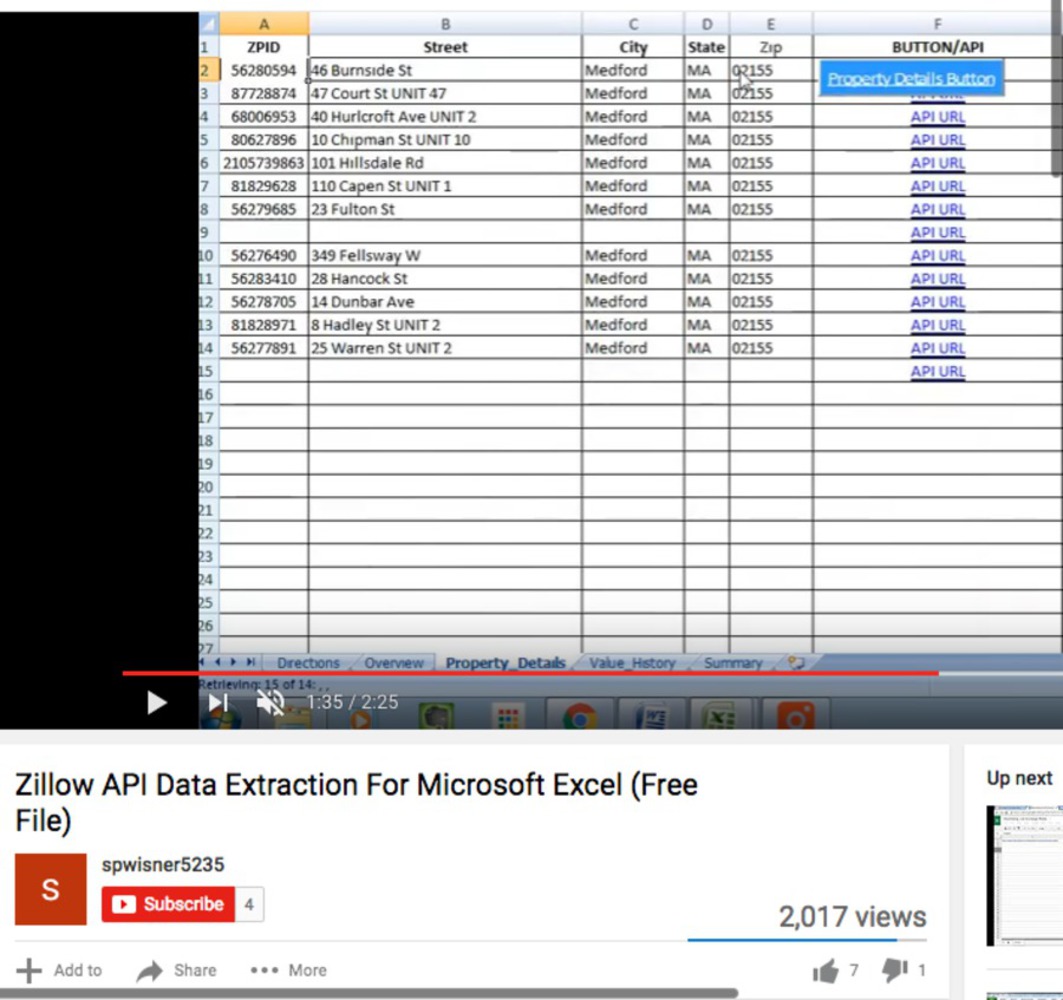
The plan was then to get the addresses of houses, pinpoint them using latitude and longitude coordinates and map them on Blender with their corresponding z-value which would correlate to the value of the real estate. I downloaded and ran the API I found on Youtube to mine and extract the Zillow data online. The problem with this API was that you had to manually put in the address and then the API ran, rather than it running for the geographical window that I had. The API tutorial is shown below. A lot of time was wasted in trying to get this API to work, as it also only worked on the Windows computer.
Google Maps, along with every other map provider I could find online, did not give a list of addresses within a region or even a street. There were online marketing companies that would sell that data, although the price was too high. I checked sanitation records, tax records, and other places online to see if there was a way to gather a list of addresses but there was none. None of Google's API's had that jurisdiction either so it looked like it would have to be done manually.
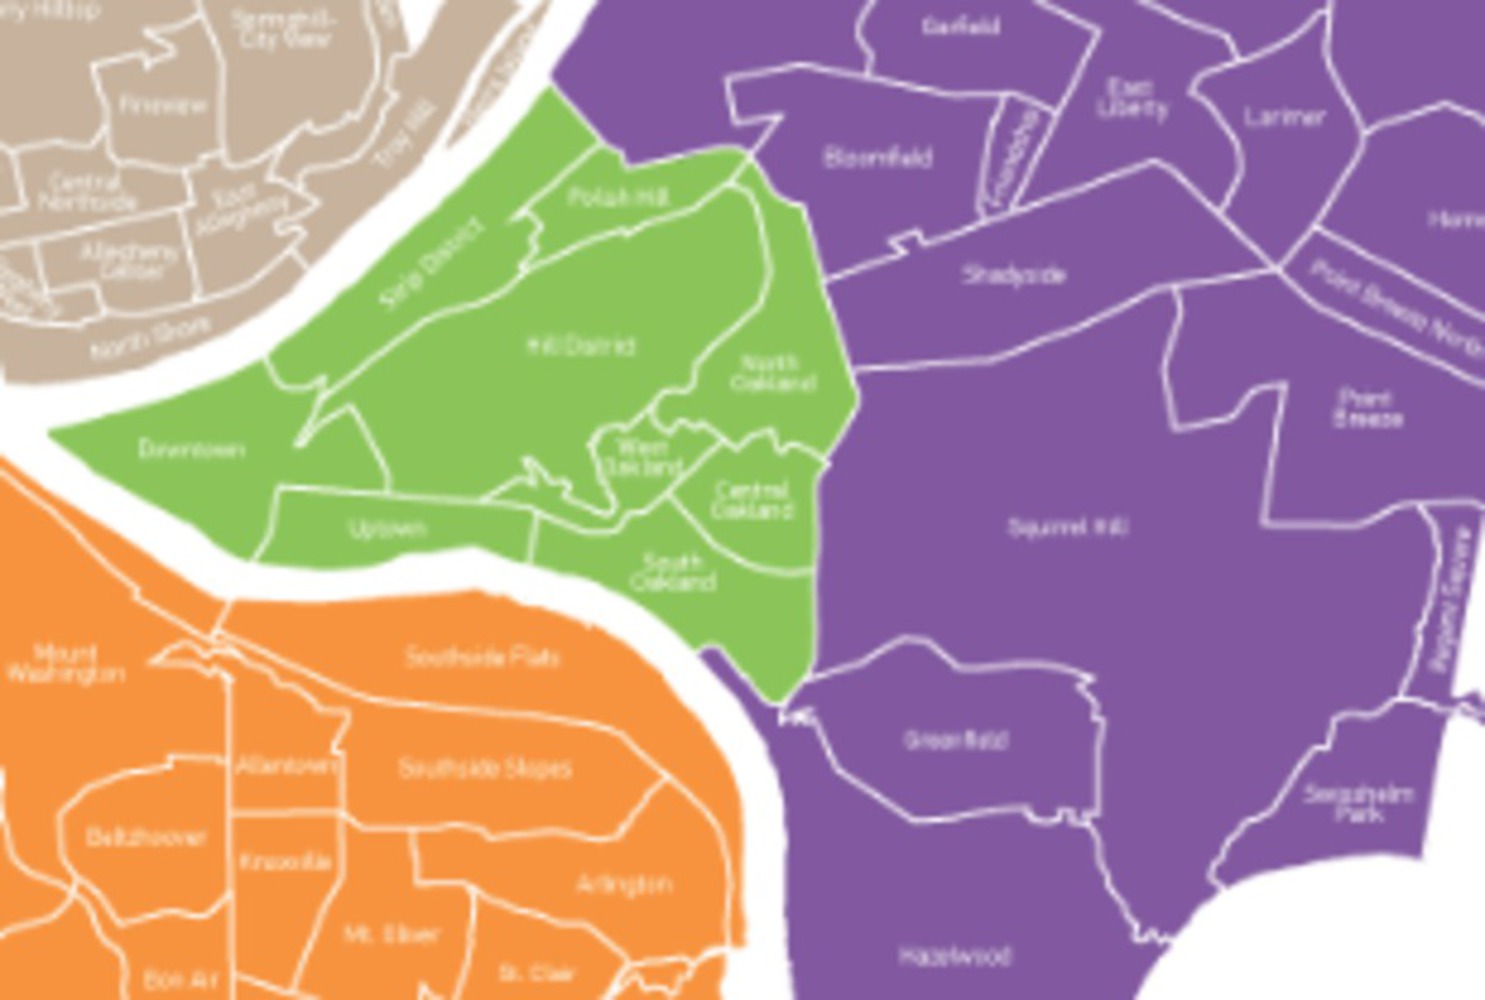
So instead, I decided to go another route. First, I separated Pittsburgh into different regions. The color shading on the map below represents the different zipcodes, and this is broken down further by neighborhoods. I then took a basket of real estate properties by manually choosing several houses within each given neighborhood and wrote down their addresses. This basket amounted to hundreds of houses.
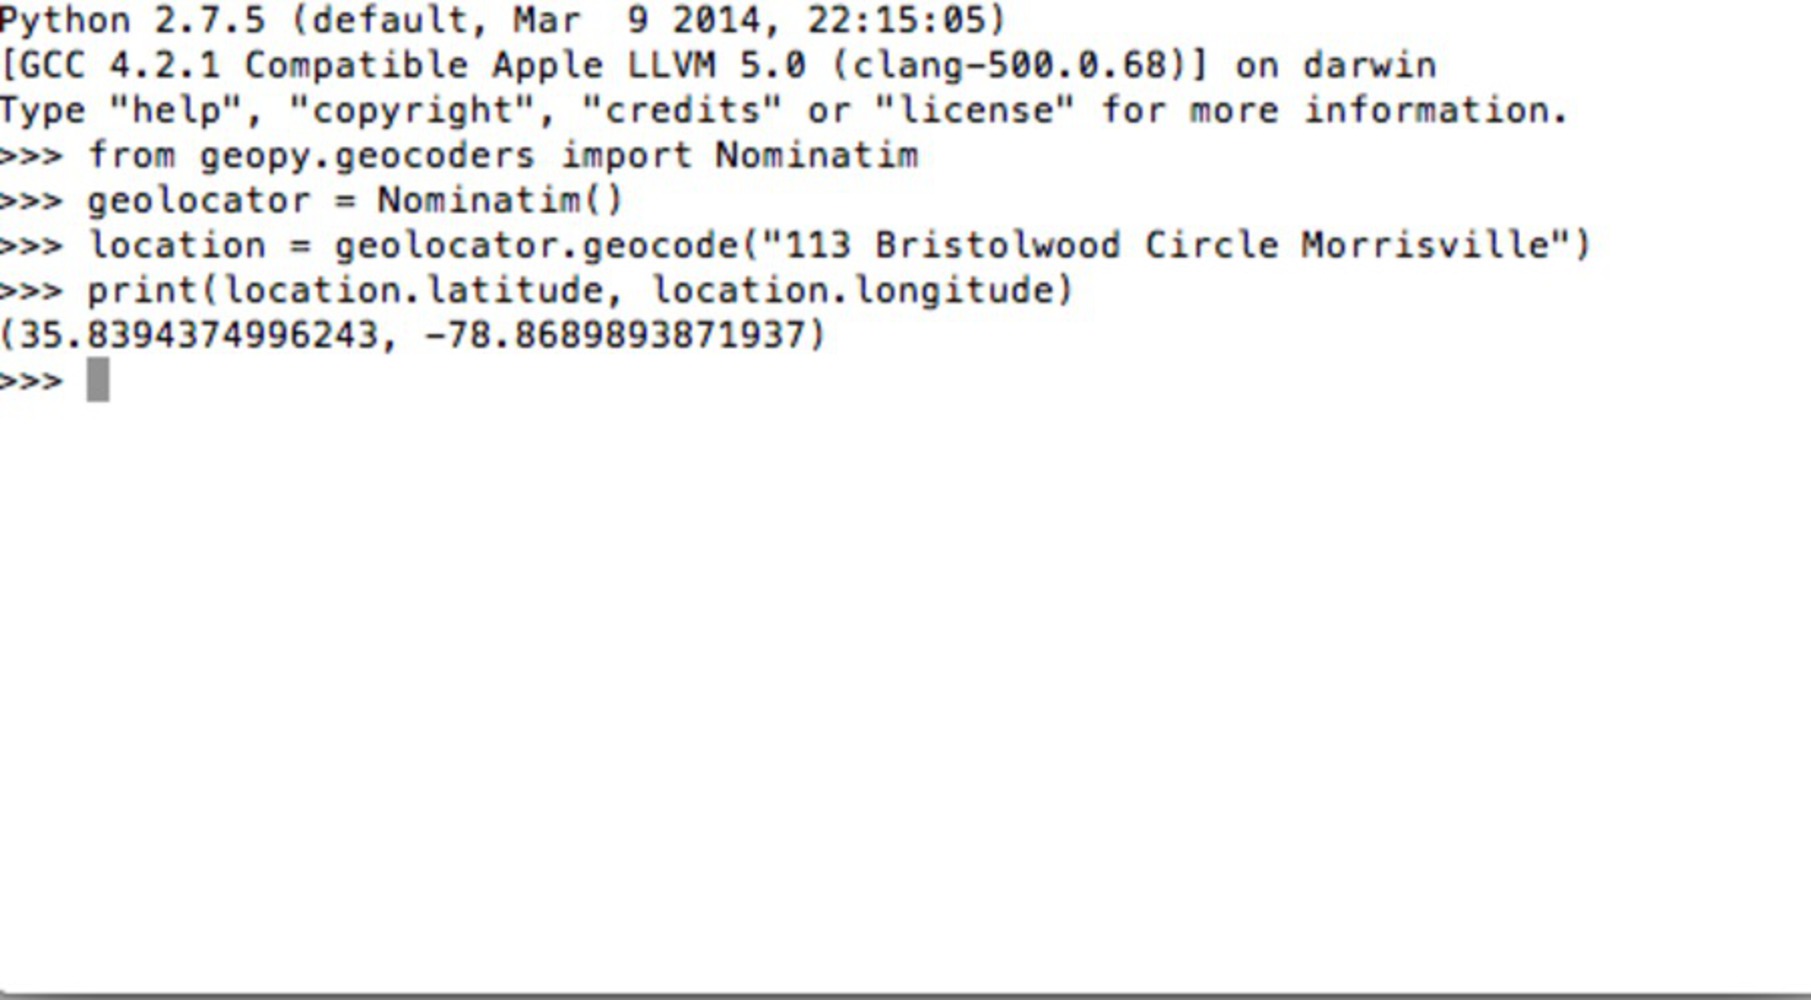
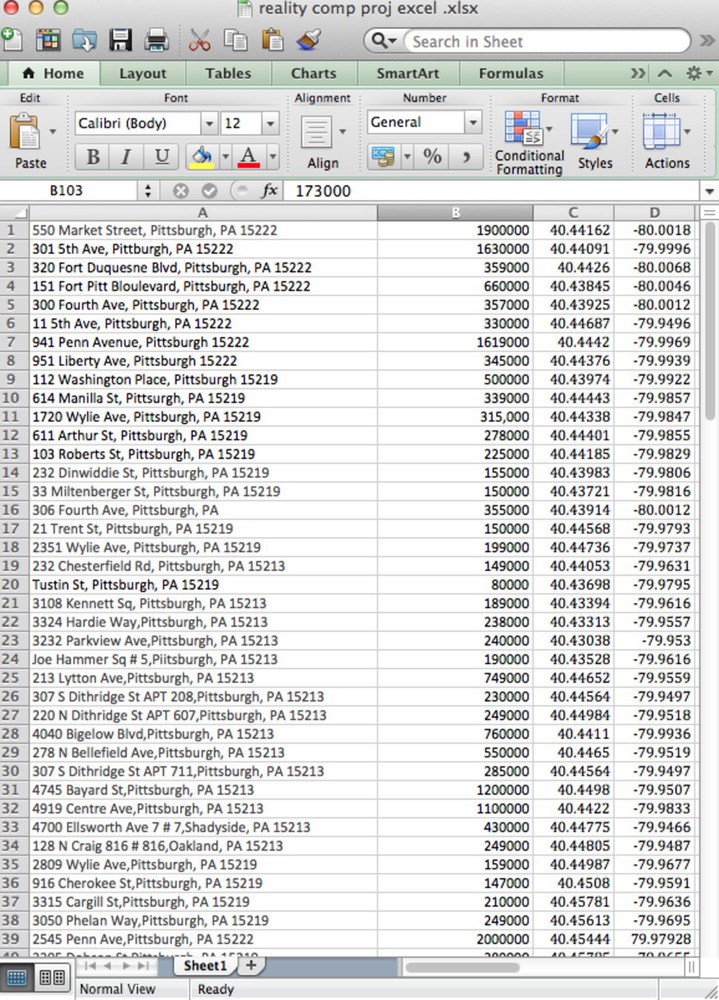
I installed PIP on my computer and then geopy using PIP. After several youtube and github tutorials, I was able to write a short code (below) that inputed addresses and outputted Latitude and Longitude values seen below. This did not work on my pyzo python editor so I had to use Terminal. I then inputed every address one by one into this code and copied and pasted each of the LAT,LONG coordinates into the excel file. This, along with earlier, became very tedious as I had 100s of lat, long points to put in each into different cells. There were some problems with Geopy as sometimes it spat out the wrong coordinates that ended up in Nebraska or etc. I cross referenced each of the coordinates with 4 bounds I made which encompassed Pittsburgh, so for the values that did not fit in the bounds I used Google's tool function to get the more accurate coordinates by plugging into those addresses into Maps.
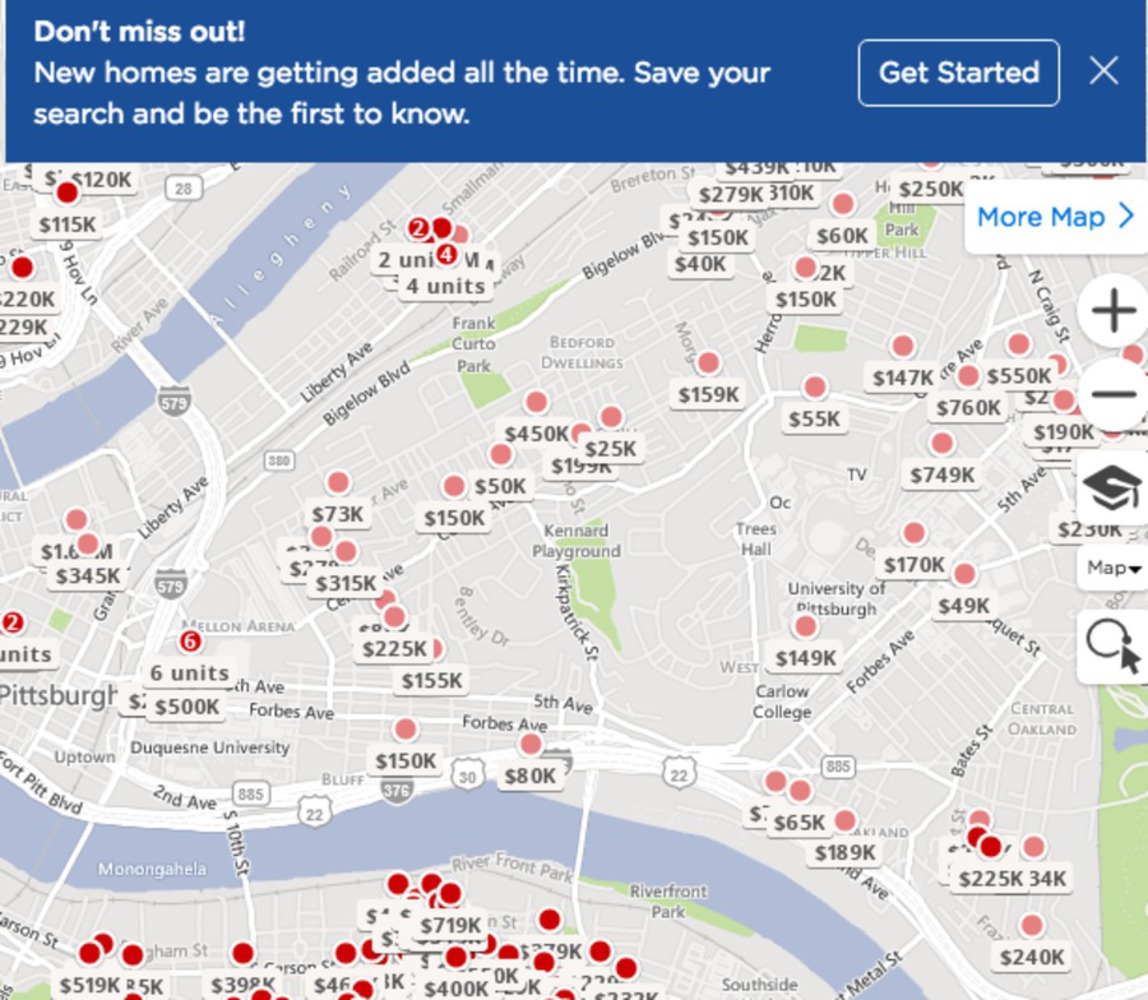
I went on Zillow and searched up each address that I had on my excel sheet (below) and wrote down the z value besides the address and coordinates on the excel sheet. This also became tedious as all of the values had to be done manually. Afterwards, the only thing left to do about the z coordinates is to scale them into Blender z-values into topographic hill values.
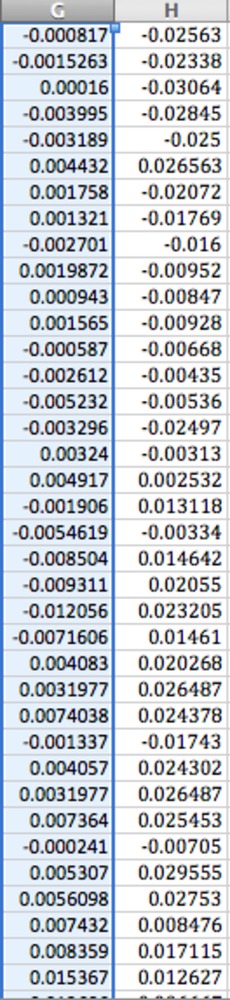
I then was able to import a map of Pittsburgh using Online Street Maps which is an open-source map online. (Crafty, the one I downloaded earlier, was not working well) Once I imported this map, I Set the Origin to Geometry. Then, I measured the map to find the exact address that the origin was on. Once I found where the origin was, I plugged in that address to my code above to find the Latitude and Longitude points. Then, I centered the Latitude and Longitude points I had gotten earlier on that origin by subtracting (x,y) from that to get the values listed below. Once I had done that, I took two random points below. I referenced them on Blender using the Blender coordinate values but this is where it went south. After trying several different math equations I was not able to come up with a scale to convert all of the Excel (lat, long) coordinates into the Blender (x,y) coordinates which were centered on another coordinate. I don't know why this was happening as I tried proportions and making my own equations.. I even re-downloaded the map to make sure the x,y axis were parellel to the equator and hemisphere lines respectively, but that did not work either.
(Points below are distance from Blender origin in Lat,Long terms)
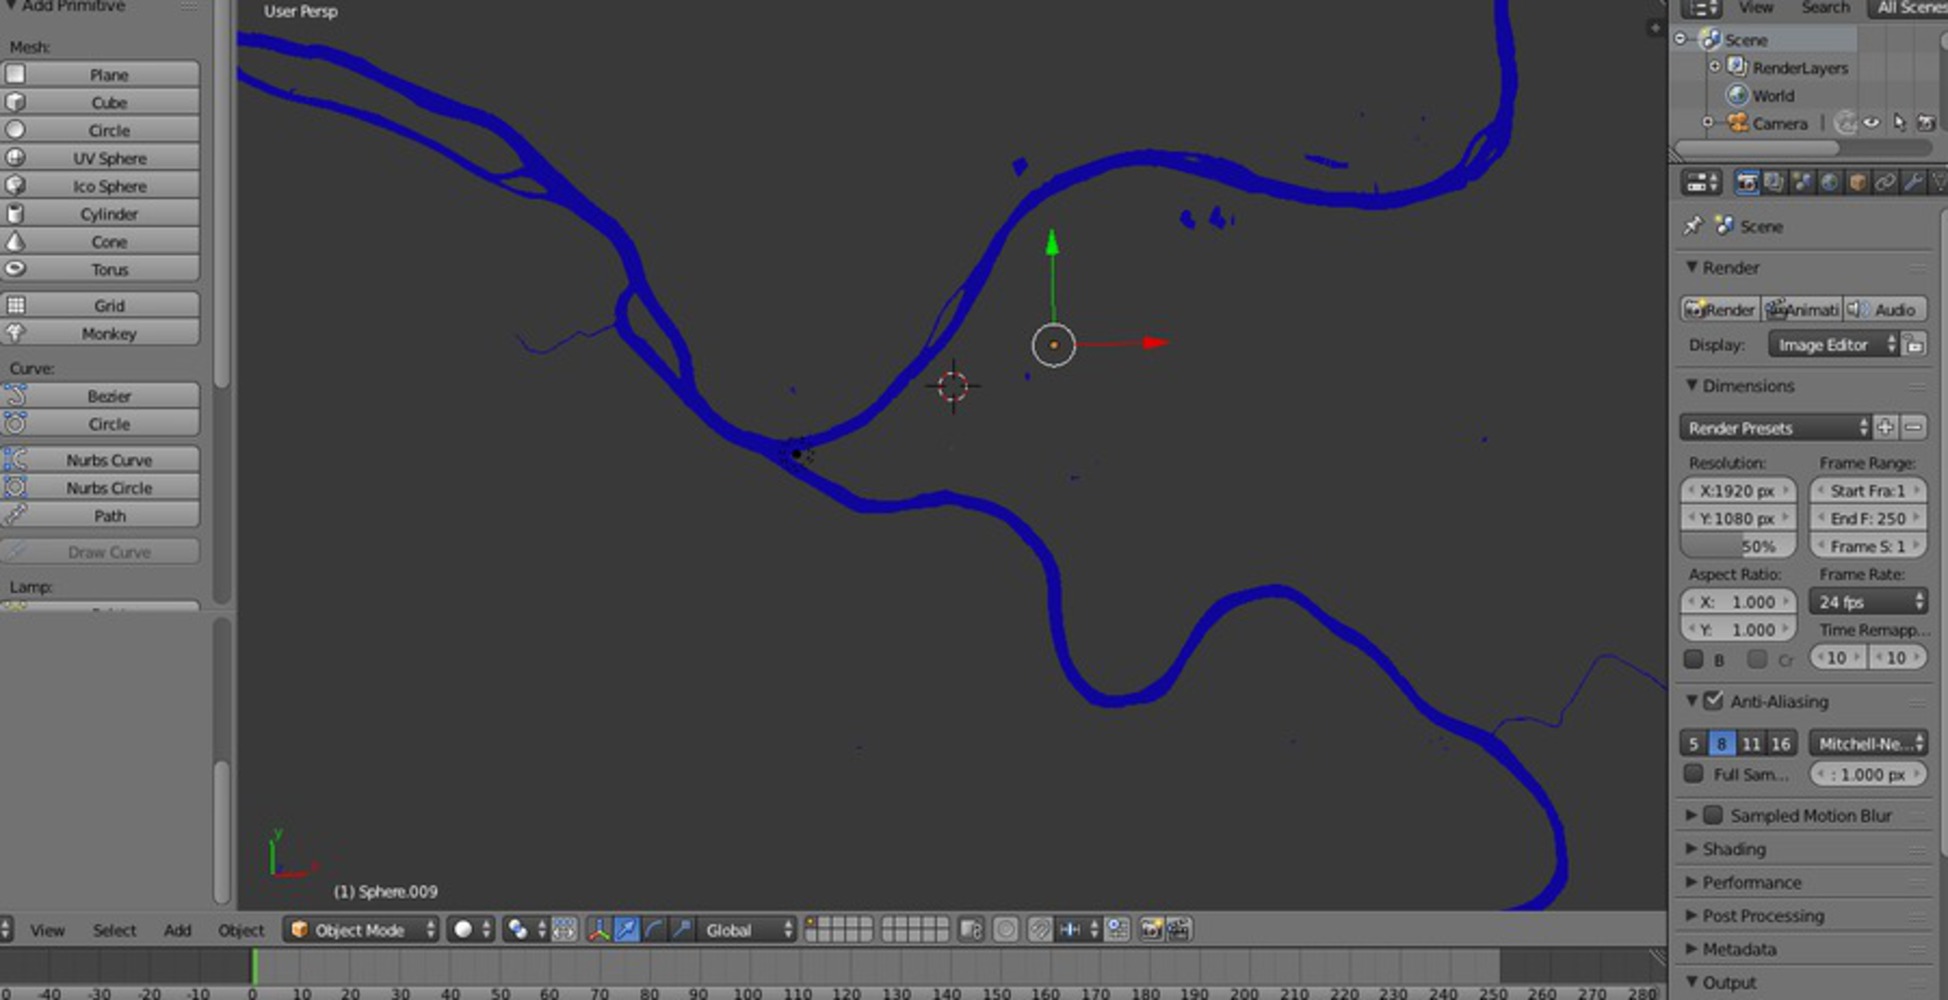
Below is the map I was able to download and edit on Blender. Everything in this project went well (z-values, the code, getting the base map, etc), besides pin-pointing the x,y coordinates from lat,long coordinates. If that would have been possible, I then would have made each point into a half-sphere whose radius is proportional to its z-value (height=z-value). Then, I would have used a boolean function on Blender to make the resulting spheres into one object thus making the topographic map. Doing that would have probably been the easiest part of the project as I have used the Boolean function before. The one step in the middle rendered the entire project to be affected.
I would like to thank Pyry for helping me so much on this project. After taking this class, I learned how to code, how pictures and cameras work, Blender, what API's are and how to license and use them, and so much more. I have spent so many hours on this project and I will continue to until I can get this to work. I am going to continue attempting at making a model because I have always wanted to start a financial tech company that engineers financial products for markets like real estate.
For this assignment, I tried to provide a visual representation of real estate values in Pittsburgh by using a topographic map that assigned height values to areas with higher or lower property values.