Walkscore-PGH: Hill District and Hazelwood
Made by Paul Moscoso
Made by Paul Moscoso
Taking as a starting point the patented system developed by the Walk Score, the project tries to unfold the data generated for the neighborhoods of Hill District and Hazelwood in Pittsburgh for patterns in the outcomes and possible solutions.
Created: September 28th, 2017
My goal is to use different datasets to corroborate the information, and by self-analyzing data, learn about the processes and how can we develop our own criteria and metrics. Once we have learned that organizations like WPRDC provide a plethora of sources that anyone can use and take advantage, I ask myself, as a pseudo data analyzers, amateur speaking, can we compete with companies that produce great amount of studies and outcomes that represent a valid source of information for the common public and also government, academia and related groups?
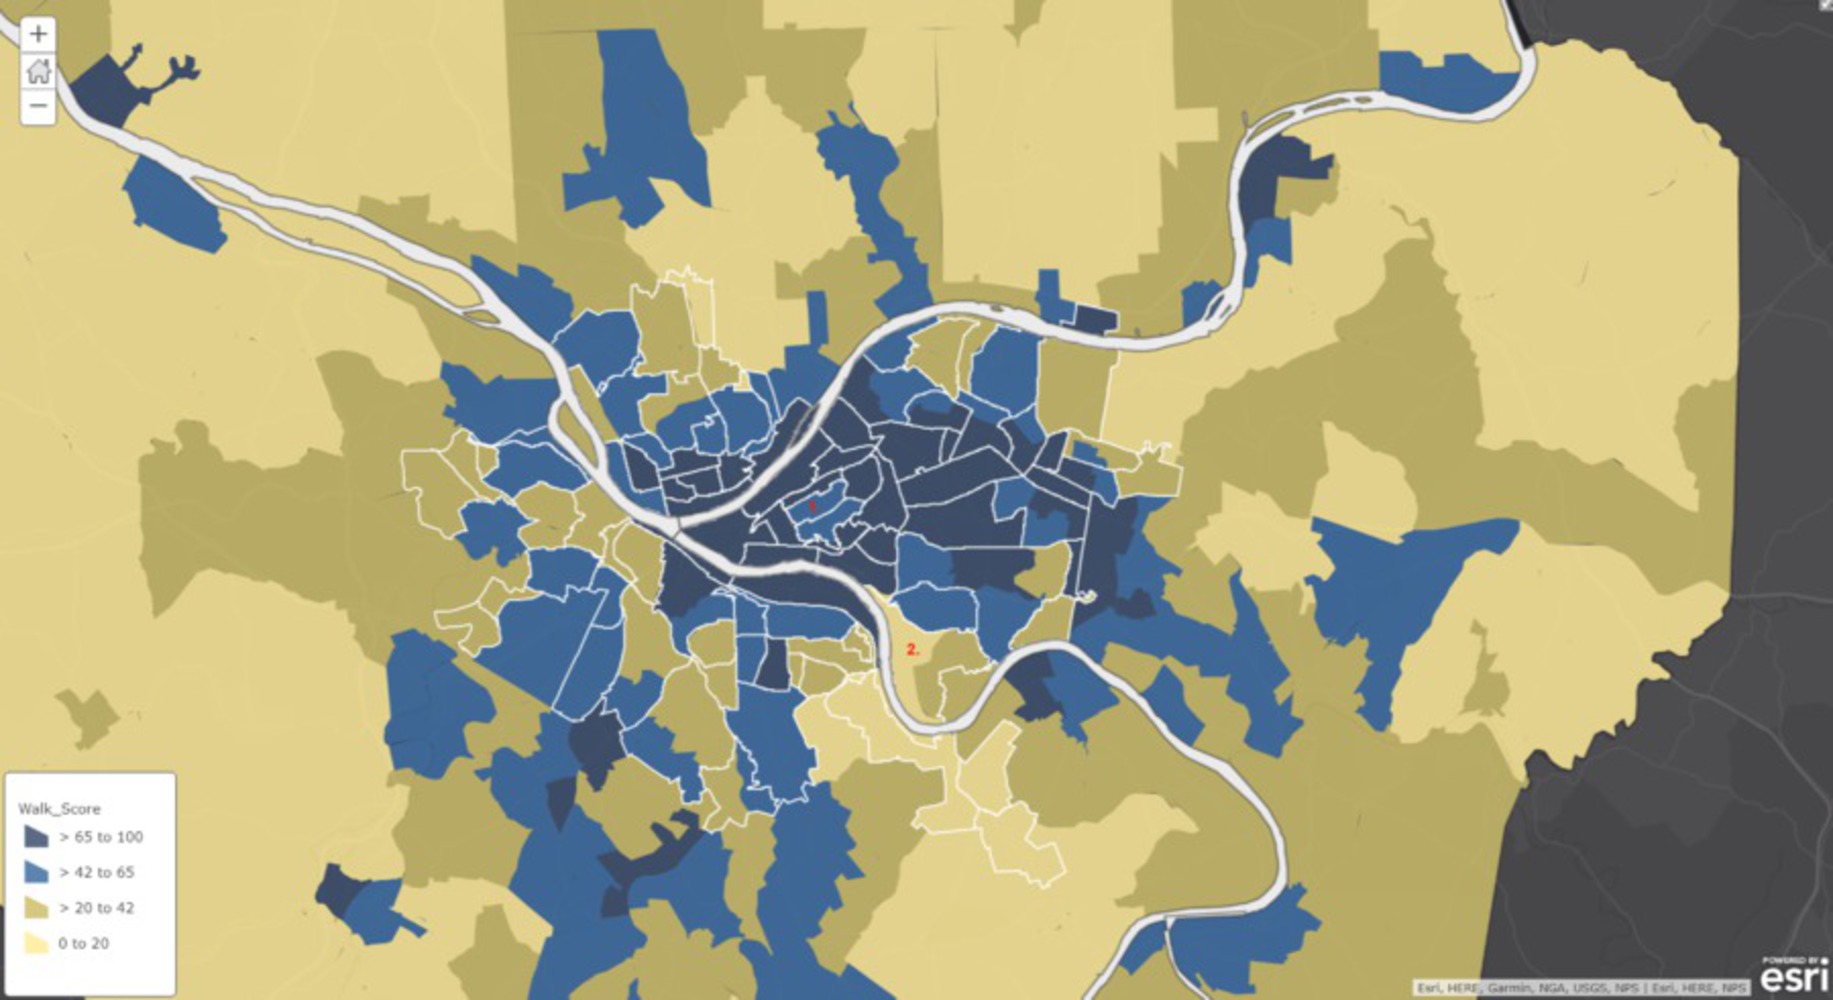
Looking at the dataset of the WPRDC, I found an interesting study developed by the Walk Score company. The criteria used for this study is the following.
" For each 2010 Census Tract centroid, Walk Score analyzed walking routes to nearby amenities. Points are awarded based on the distance to amenities in each category. Amenities within a 5 minute walk (.25 miles) are given maximum points. A decay function is used to give points to more distant amenities, with no points given after a 30 minute walk. Walk Score also measures pedestrian friendliness by analyzing population density and road metrics such as block length and intersection density. Data sources include Google, Education.com, Open Street Map, the U.S. Census, Localeze, and places added by the Walk Score user community."
Walkscores map: https://wprdc.carto.com/builder/d34f1c10-efba-11e6-853f-0e233c30368f/embed Source: WPRDC
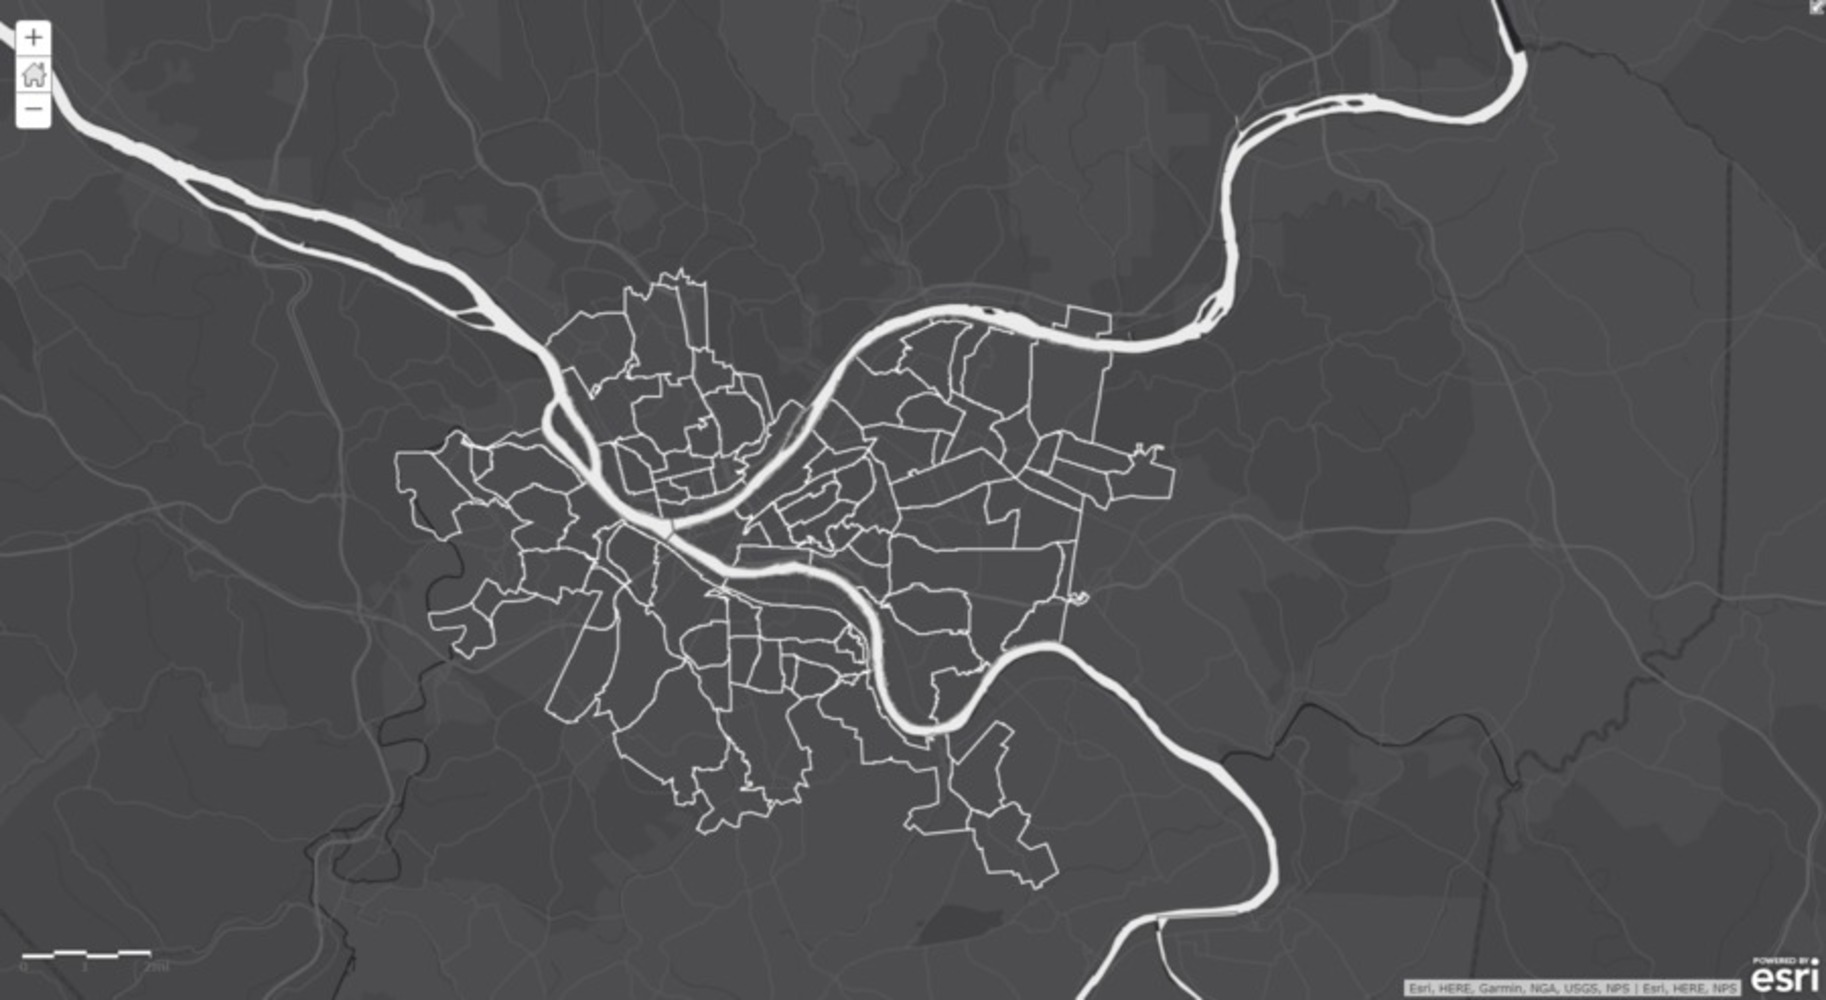
To start, I thought that in order to create a product that will compete with the Walkscore Study I need to pick information related to the same theme. I create a dataset with the city of Pittsburgh, its neighborhoods and a basic layout to understand the map. For that, I develop my project in ArcGis Online, because of the benefits of providing a foundation for the data to be uploaded. Moreover. I base my research in three datasets: Transit routes, Pittsburgh Crosswalks, and the steps in the city (see links). This information picked is based on the necessity to compare data related to pedestrian activities and how communities use the physical infrastructure to move in the city.
Port Authority of Allegheny County Transit Routes: https://data.wprdc.org/dataset/port
City of Pittsburgh Crosswalks: https://data.wprdc.org/dataset/city-of-pittsburgh-crosswalks
City of Pittsburgh Steps: https://data.wprdc.org/dataset/city-steps
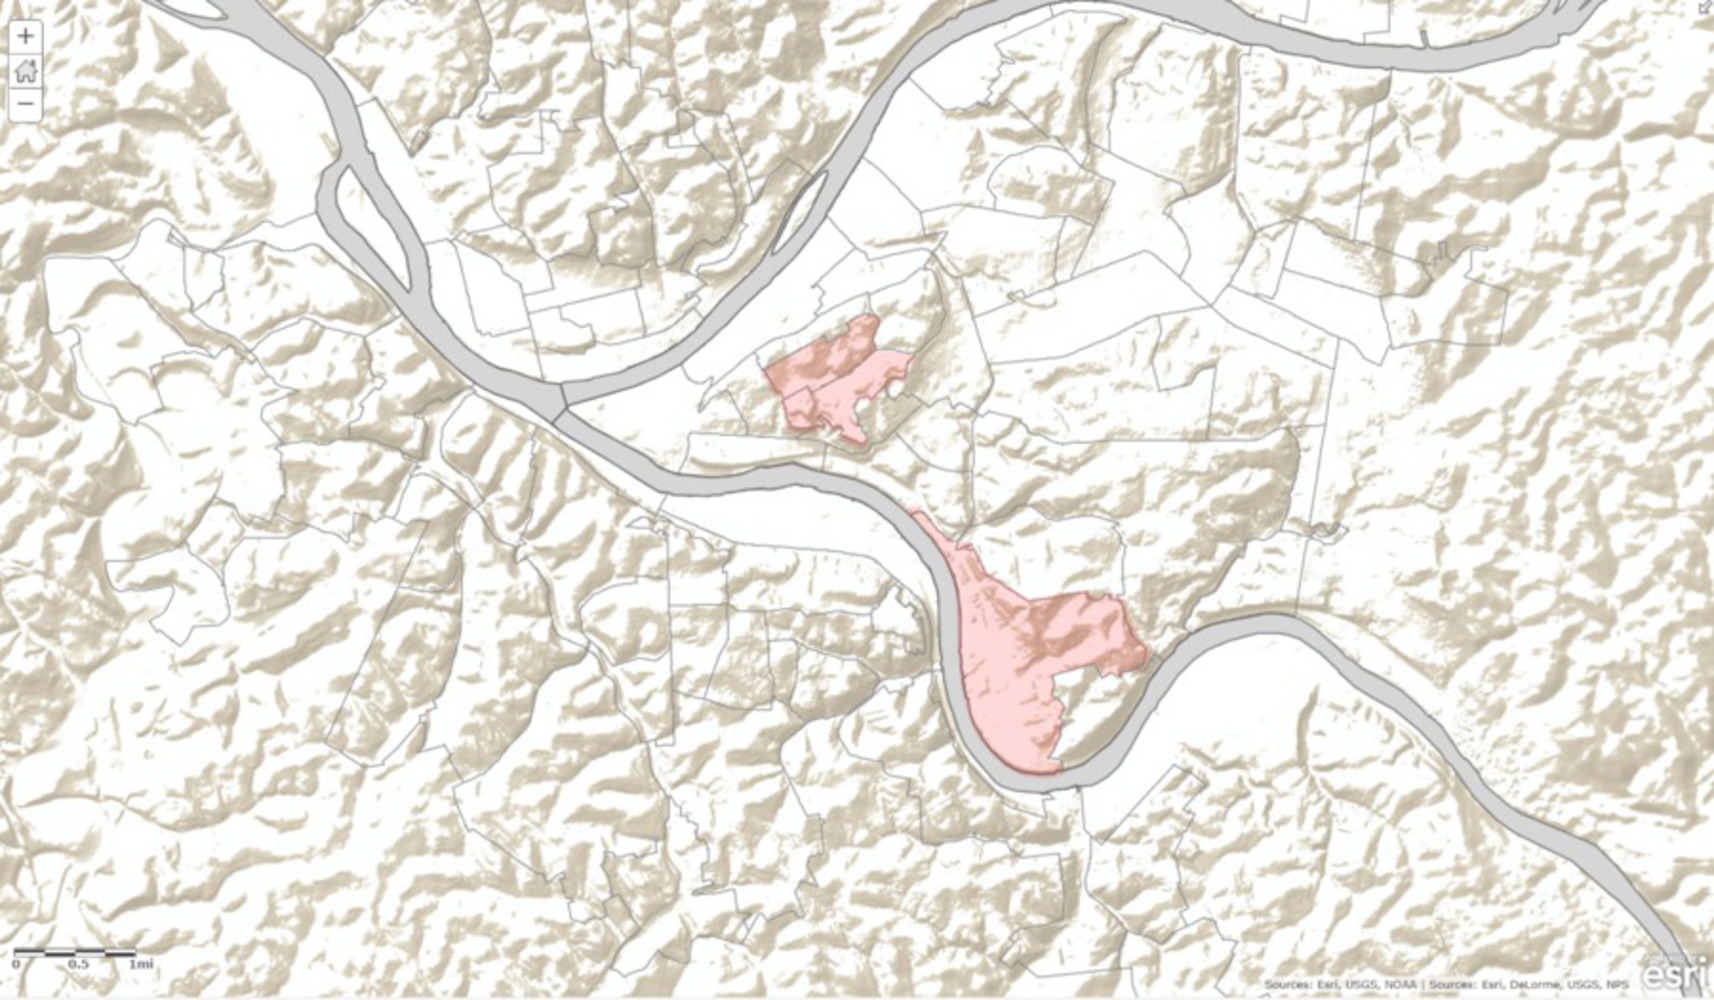
Once I have a platform to work on my thesis, I frame my work by picking two areas of Pittsburgh. The two neighborhoods chosen from the original study represent singular cases in terms of the metrics. In this way, I thought, what happens in the areas of Hill District and Hazelwood that the walkability score is different to its surroundings (1) or in general low (2)?
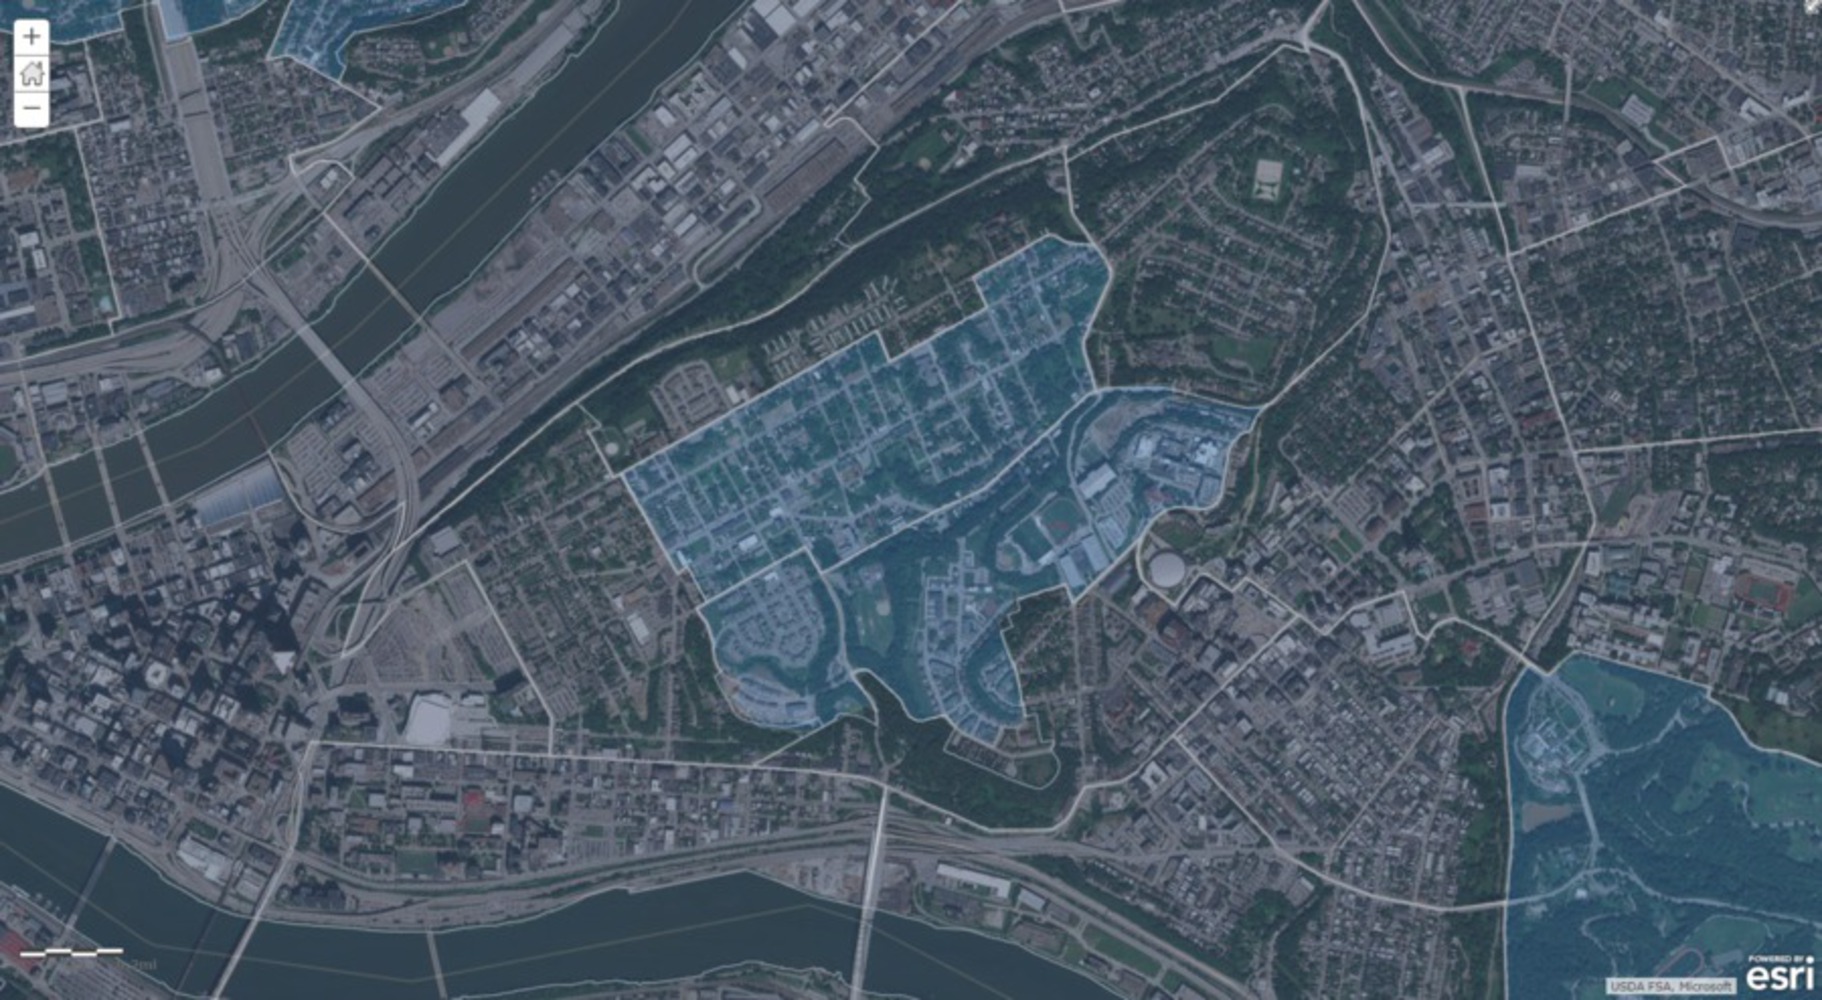
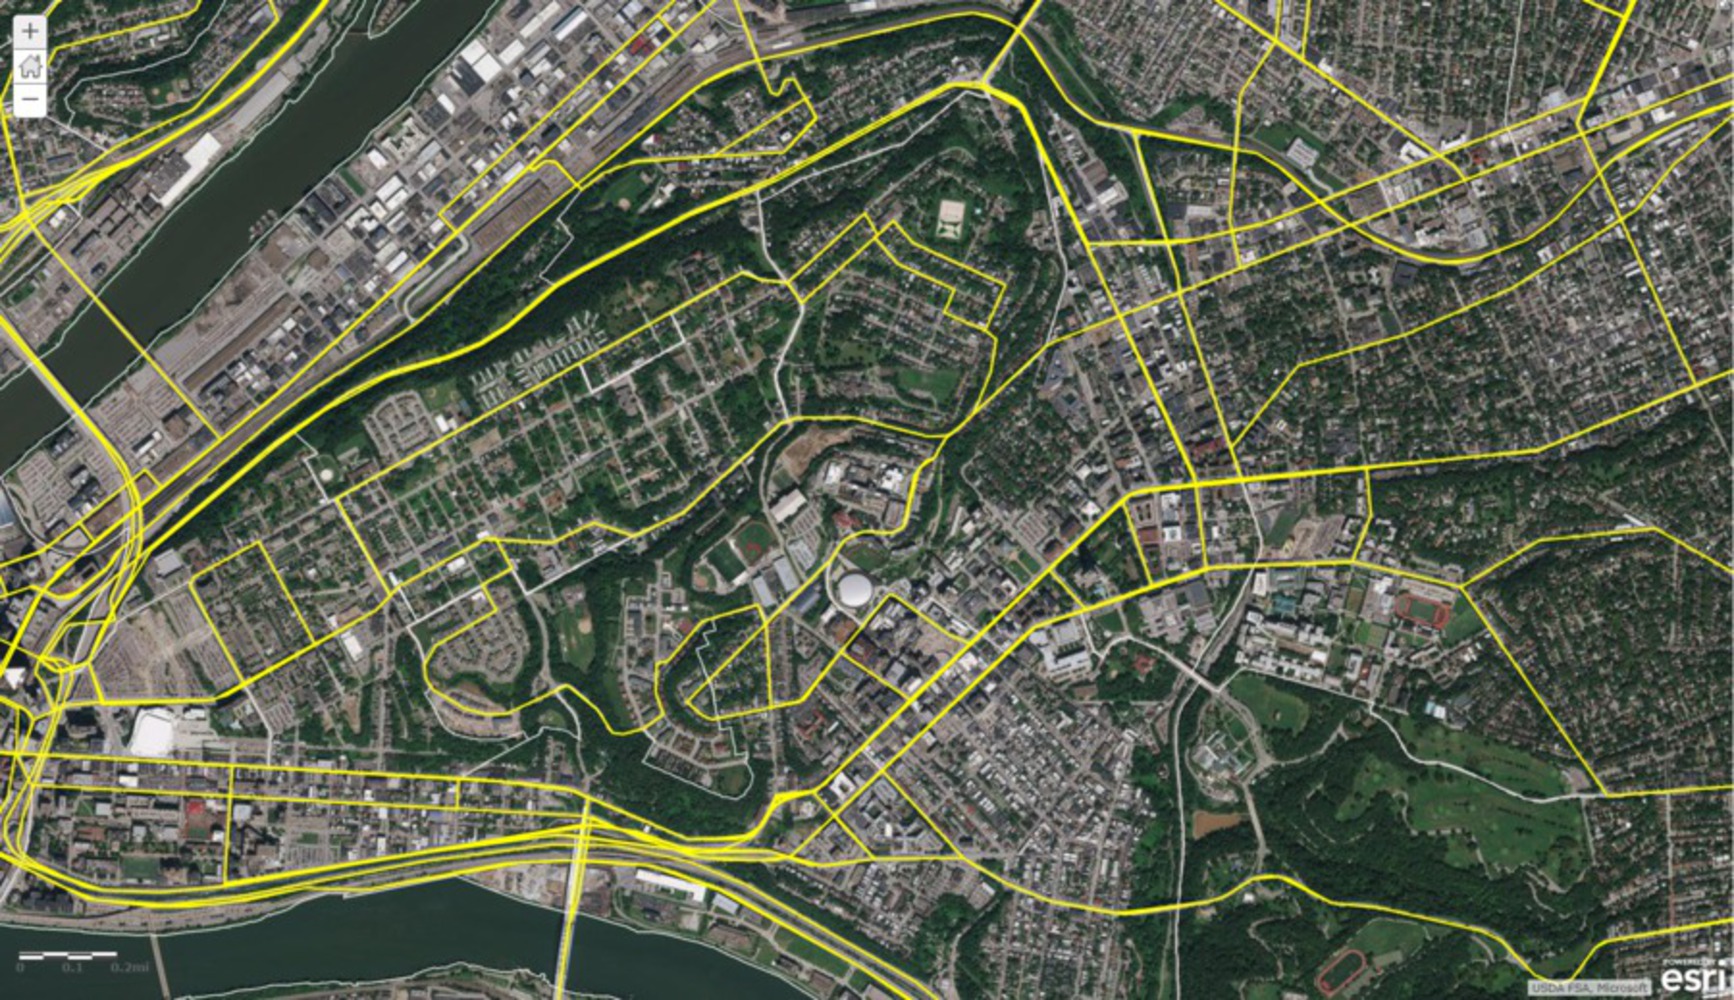
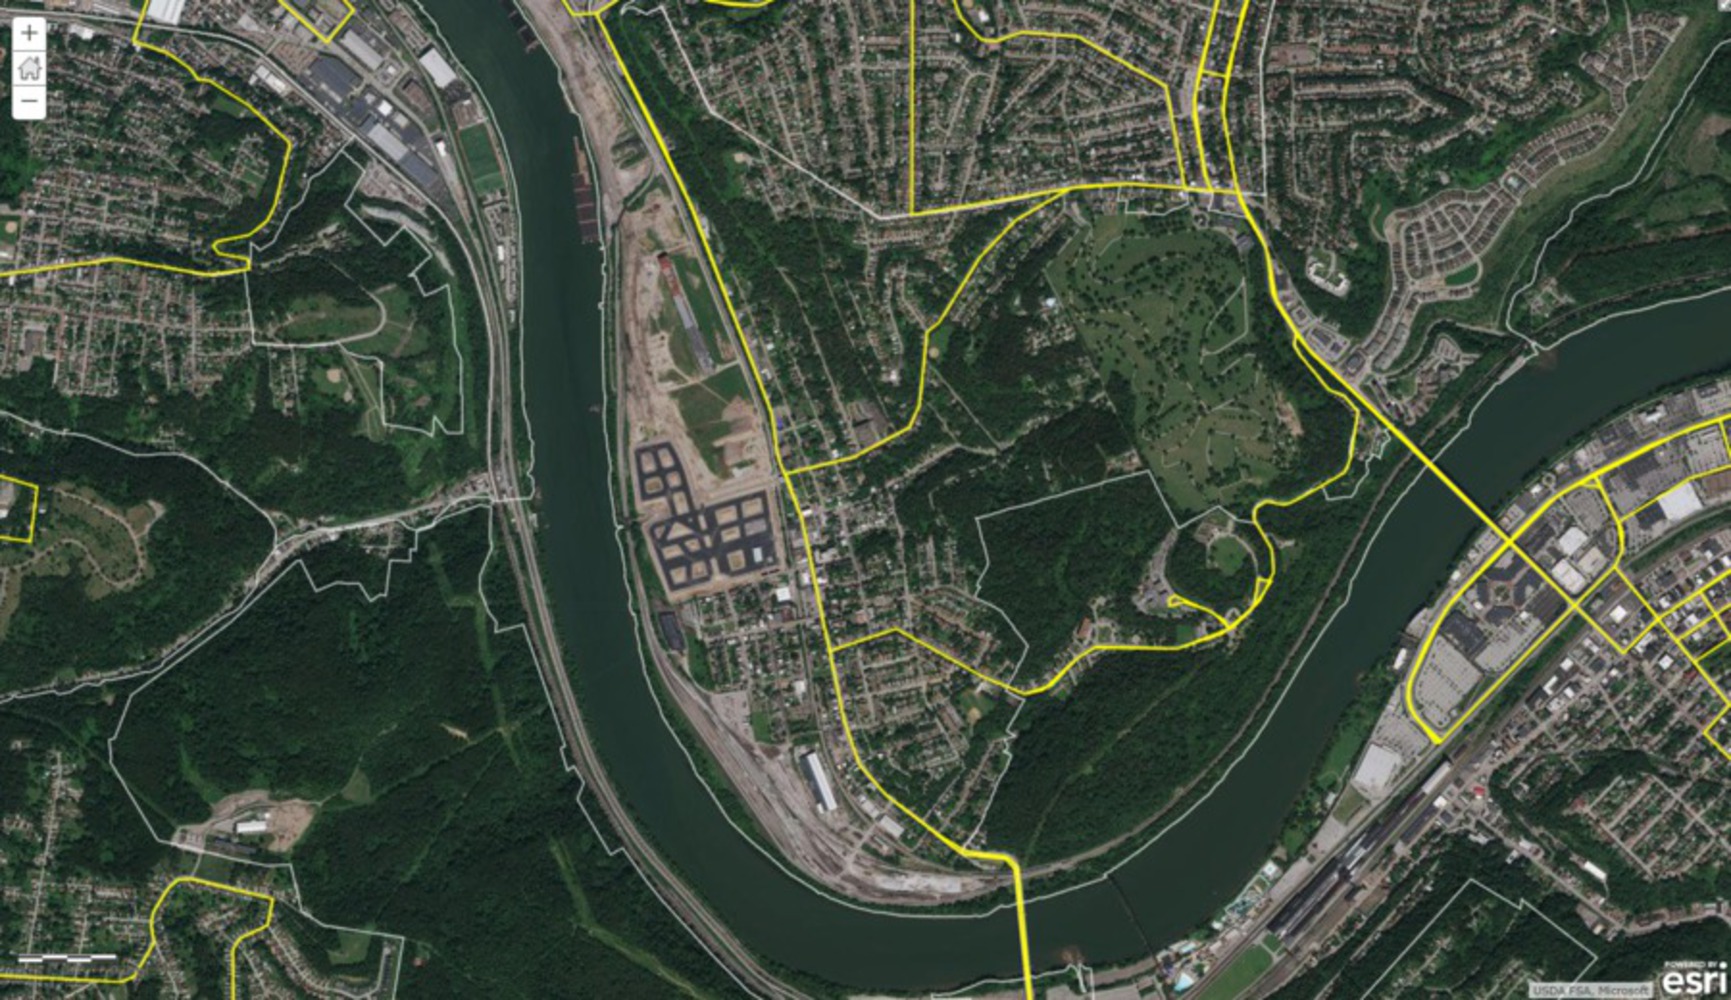
1. Transit Routes: Bus lines in the two neighborhoods. Both areas have fewer routes than others in the city.
Method: Show the bus routes on a satellite map of the neighborhood.
Outcome: Fewer bus routes, and maybe less frequency of them, can represent disincentives for people to use public transportation to go to their regular duties. If a person doesn't use public transit regularly, it is expected that his/her means of transport relies on private cars or taxis, therefore walking becomes less common.
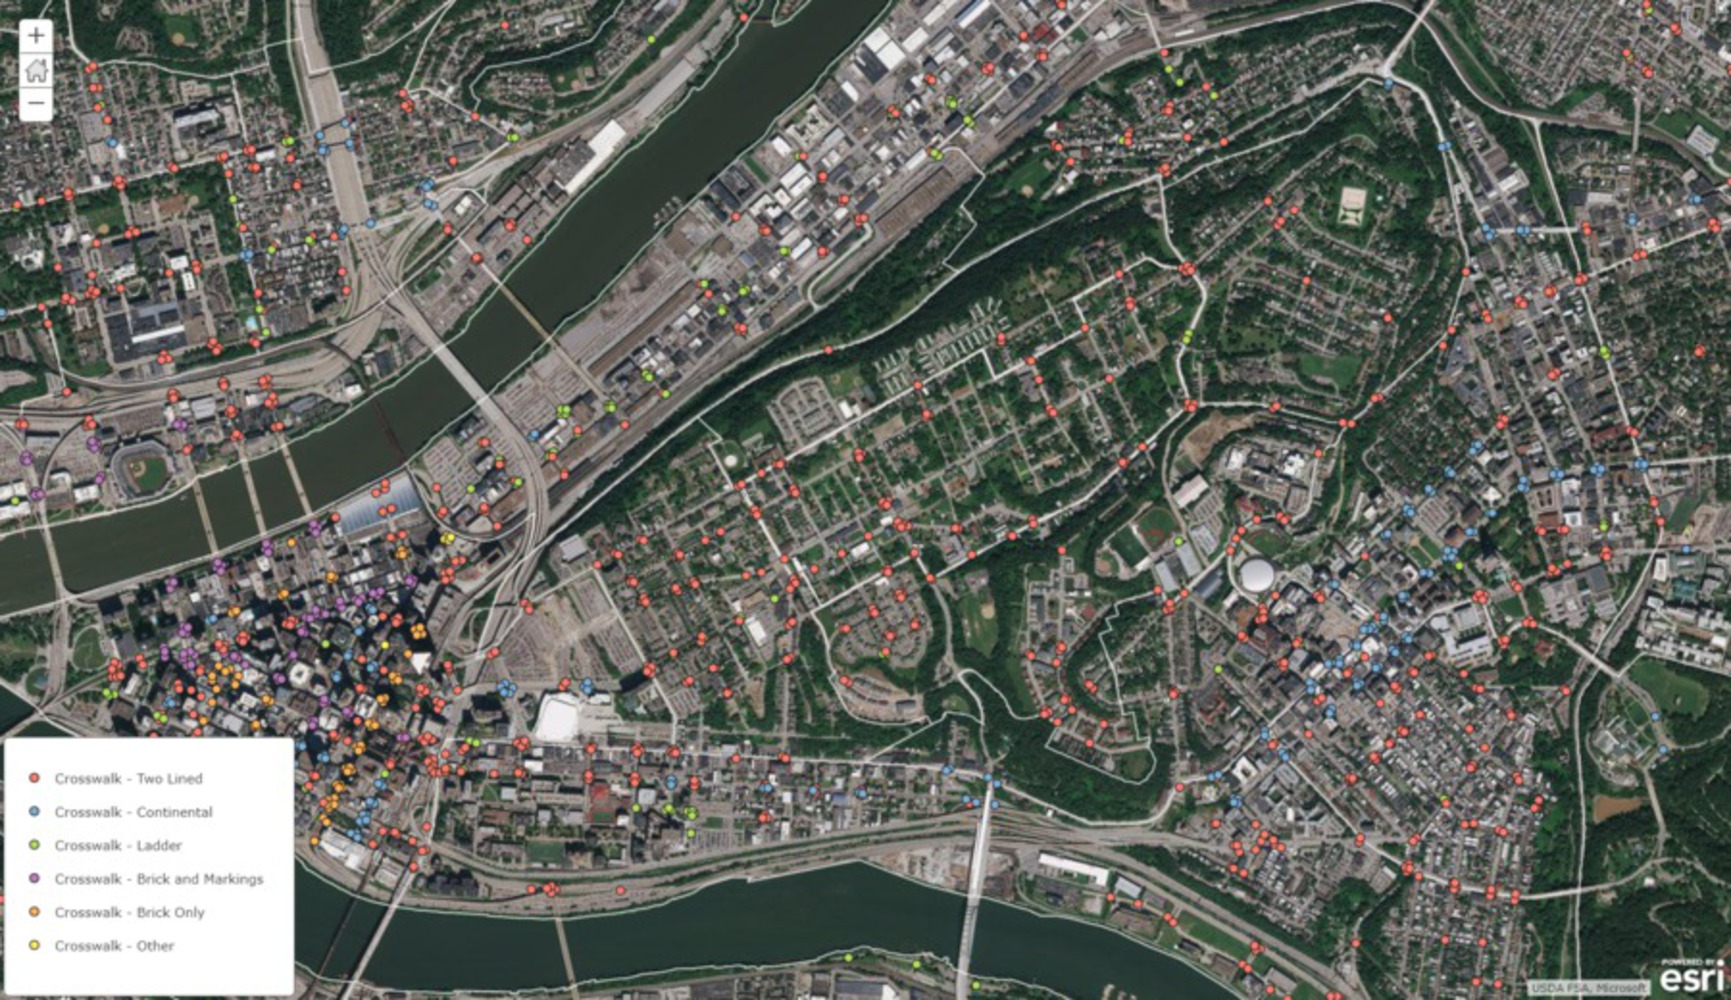
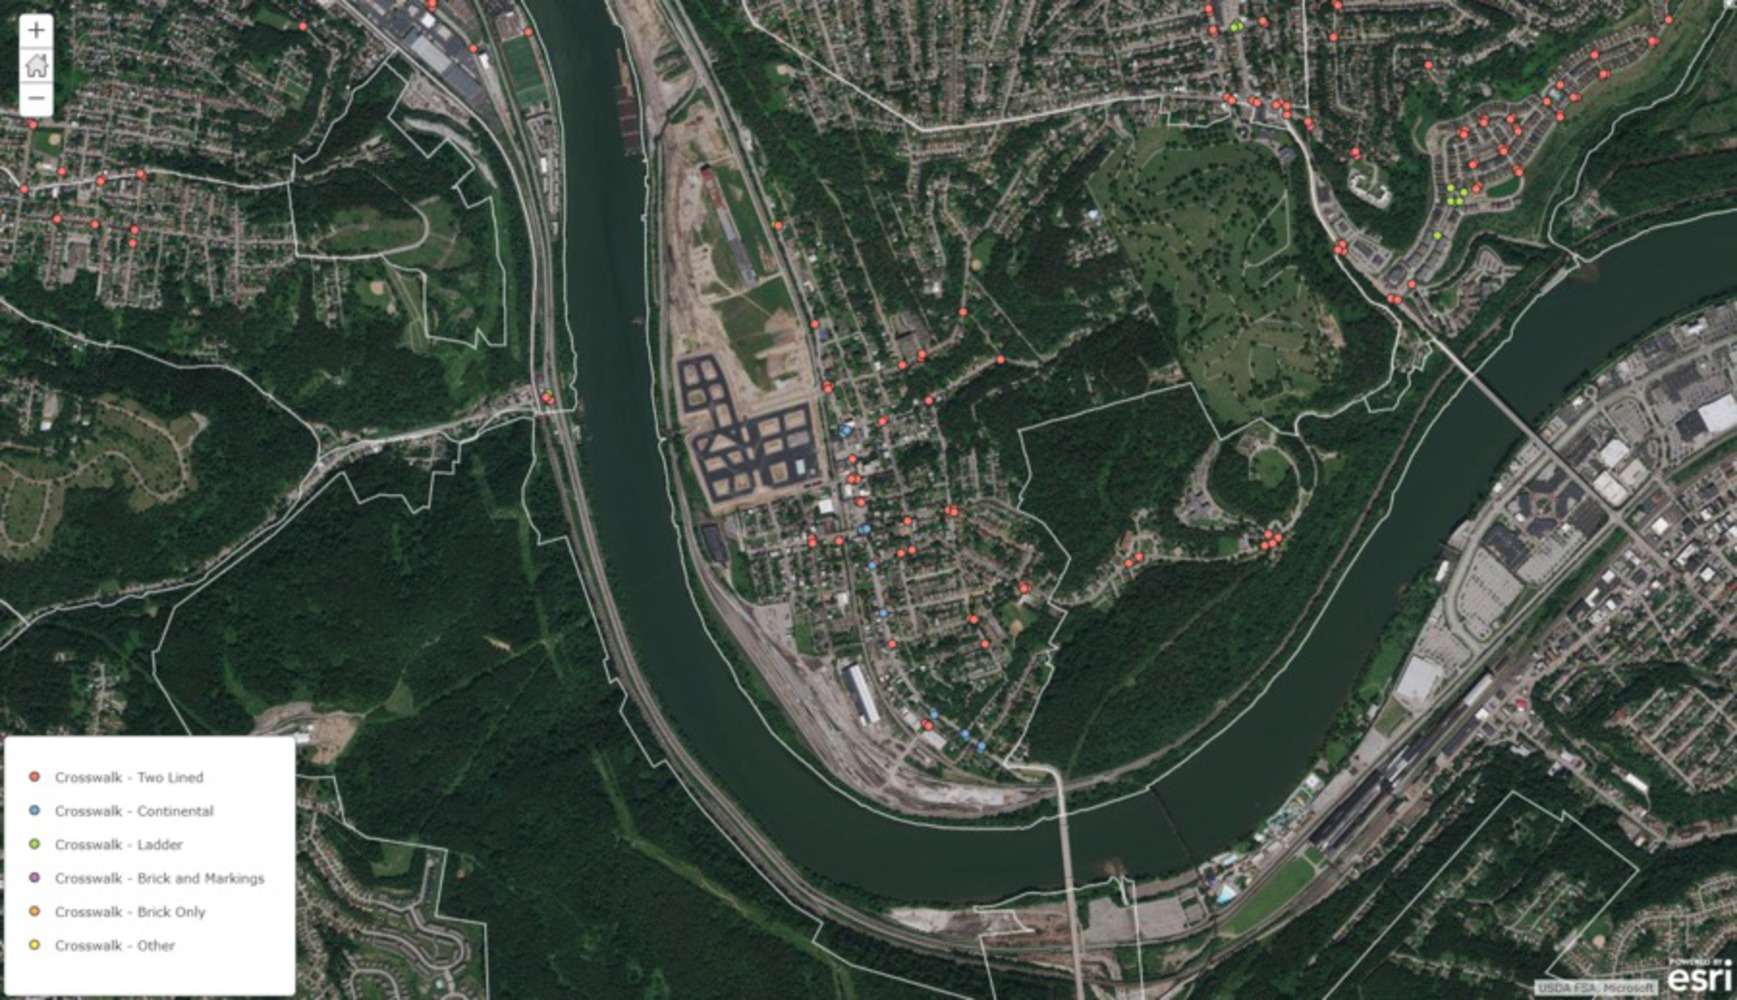
2. Crosswalks: Dots showing the different kinds of crosswalks in the city. Both areas have fewer dots and less variety than others in the city.
Method: Show dots of the different kinds of crosswalks.
Outcomes: The city maintains different kinds of crosswalks so residents and visitors can use sidewalks in a more secure manner in their ways to the different points in the city. If a neighborhood has seldom crossings, pedestrians face the insecurity to cross a street that might represent a big danger to his own life, plus if a person is accompanied by kids or dogs, the level of insecurity will certainly increase for the fear of having to take care of more than one being at the same time.
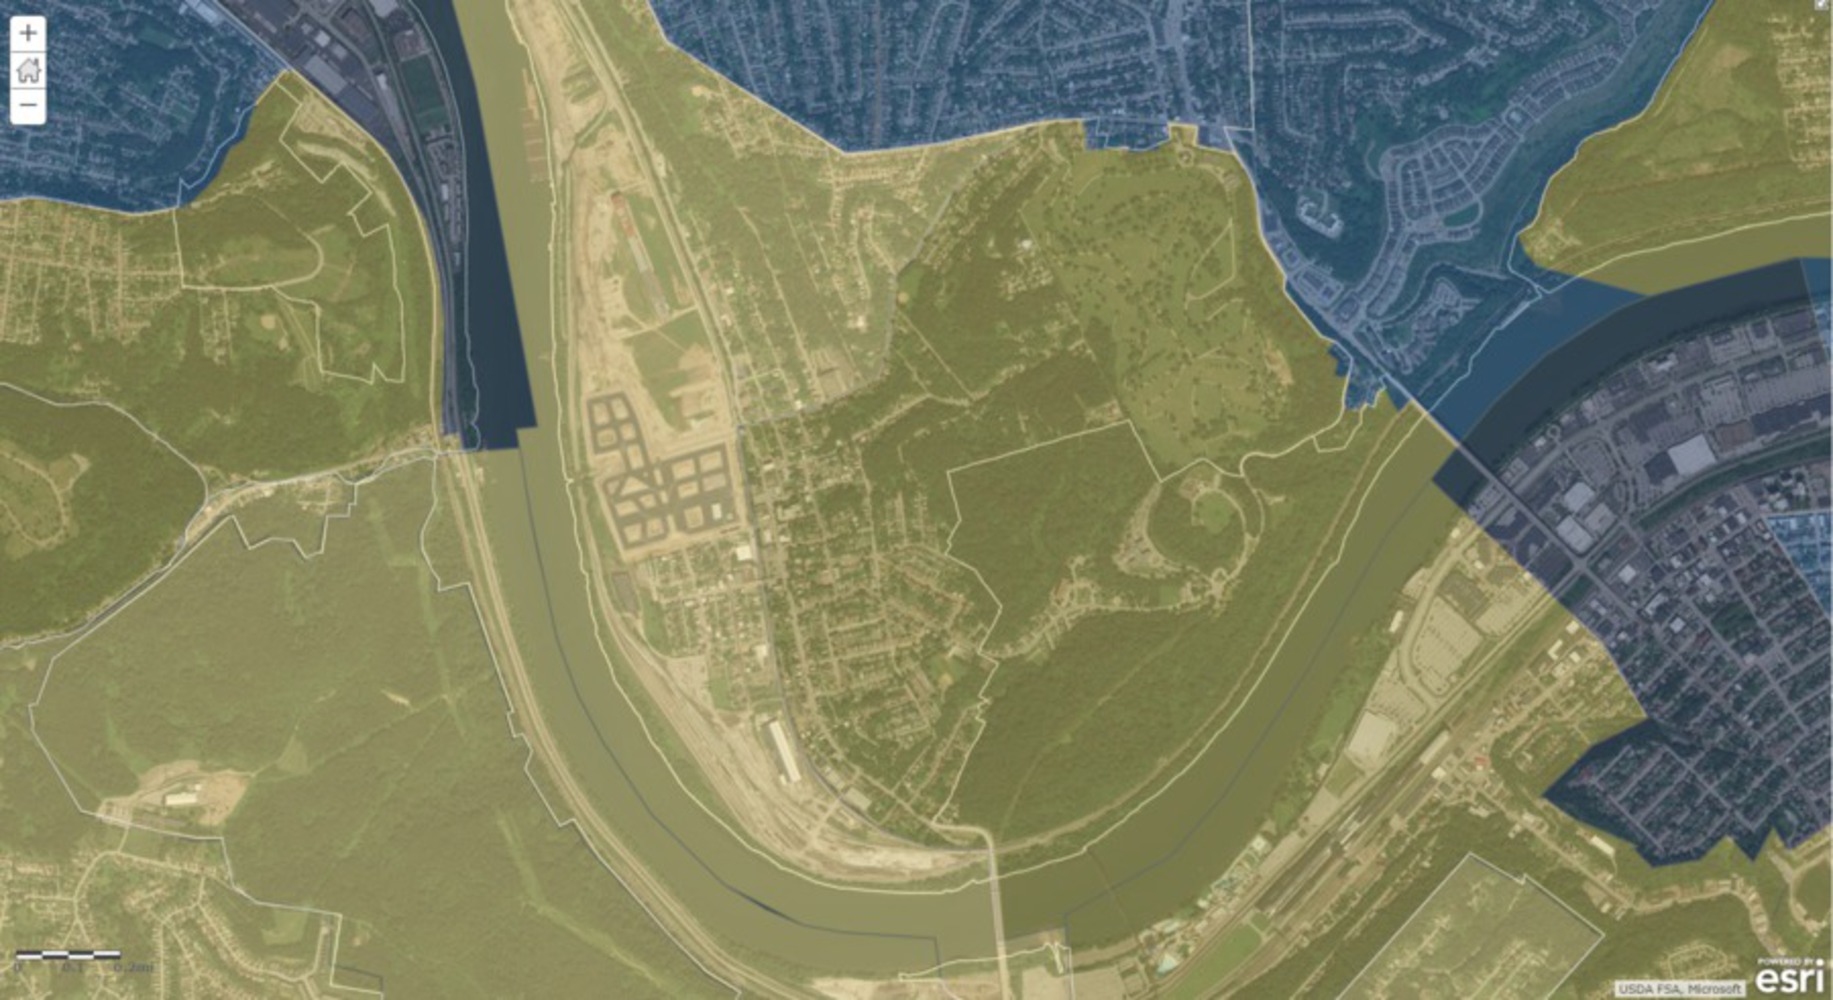
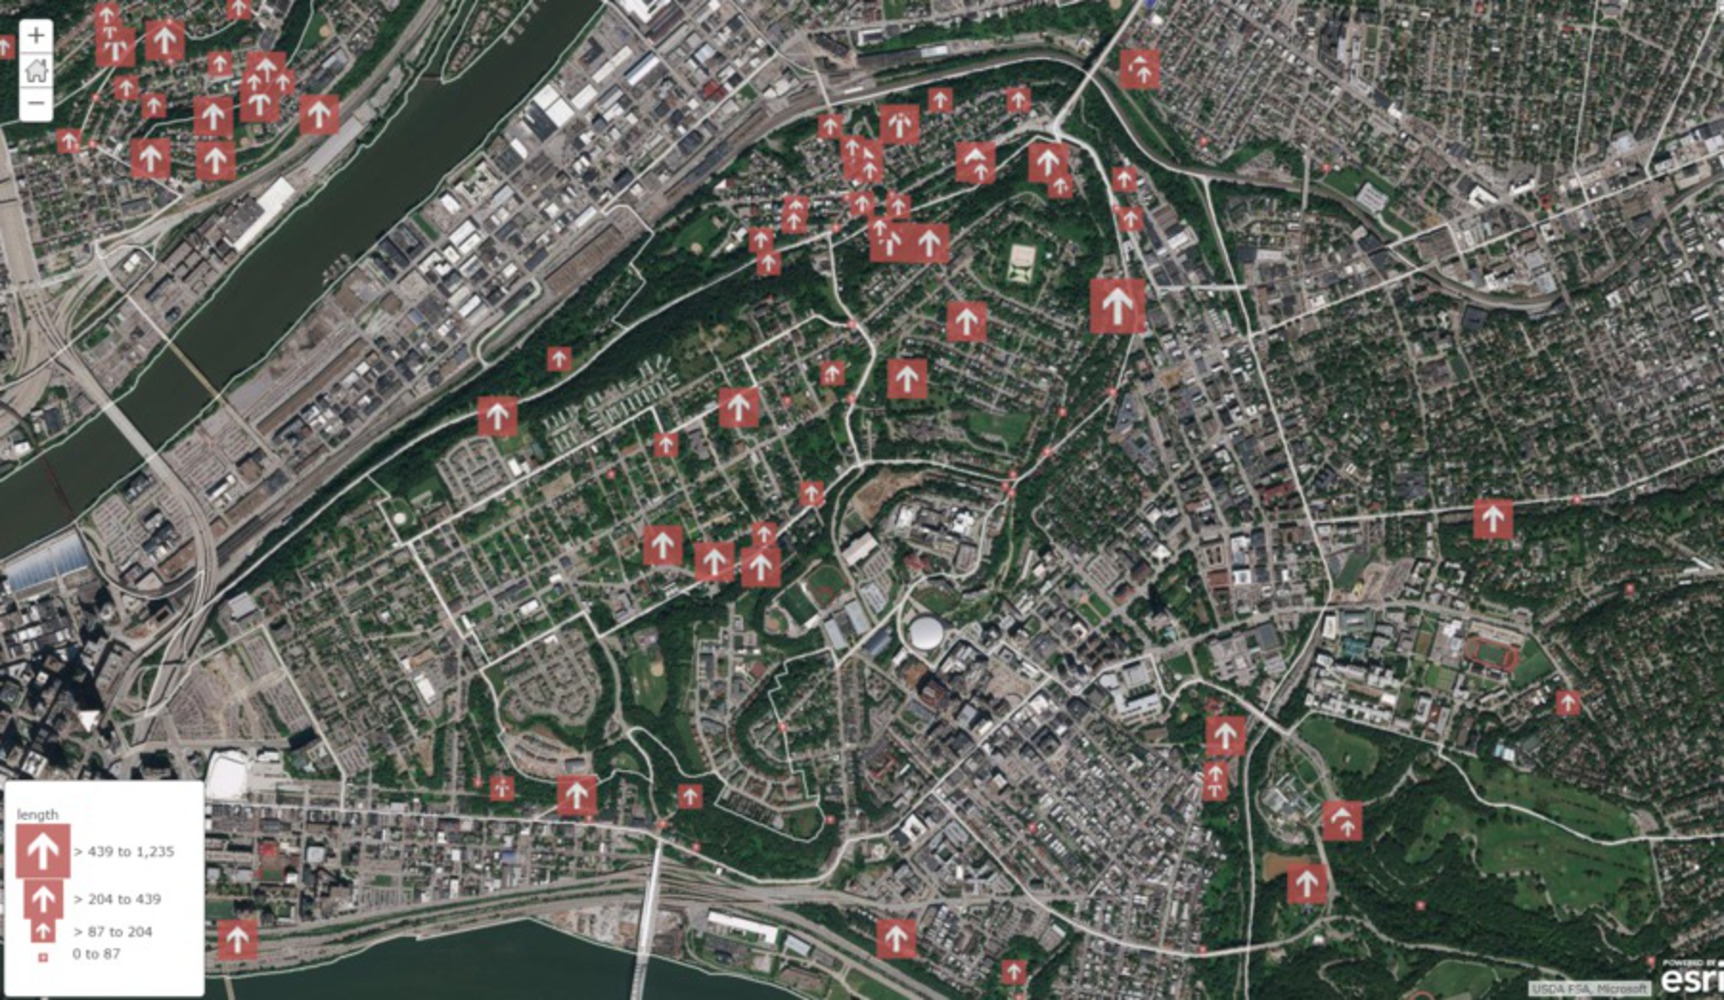
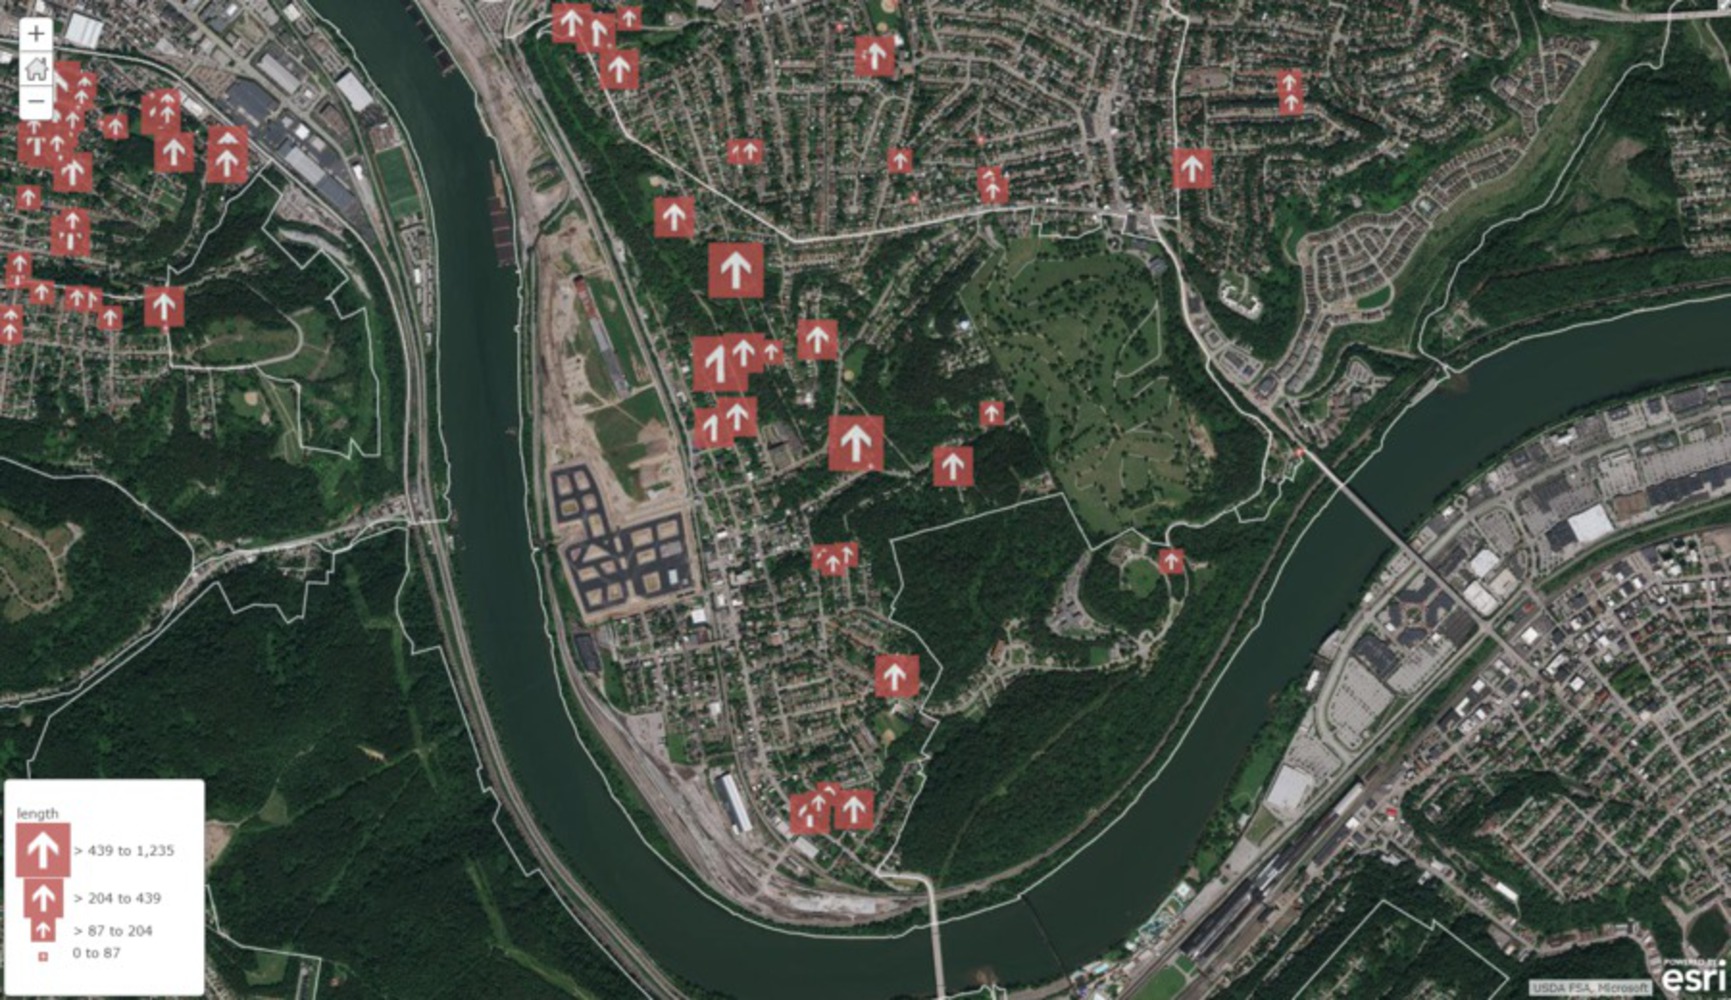
3. Steps: Pittsburgh is a hilly city, with many neighbors in very steep slopes that creates a particular and challenging landscape to walk through. The two neighbors do have a good amount of steps so anyone can go up and down the hill.
Method: Show the location and length of different steps by using an exaggerated arrow.
Outcomes: The two areas may or not be the steepest neighbor in Pittsburgh, nevertheless, they have several steps to use. In the map, as a pedestrian is easy to understand the challenge to go to another area of the city if the length and the slope of the steps are considerable. Also, some areas, like in the northern parts of the Hill District and eastern parts of Hazelwood there are no steps so the ability to communicate to other parts of Pittsburgh becomes even harder.
By working in this project I understand that produce a study of certain characteristics of a city, is not that hard and even represent a great tool to use as an urban designer. Also to unfold to of the neighborhoods of Pittsburgh I put theory in a practical matter and also understand the challenges that a city needs to face in order to provide better options to its inhabitants, as also how to reveal information using data available on the web.
I believe that the position to take to have a good level in representing accurate outcomes are base in our convictions and believes as urban designers. We can take any data to the limits but creates good graphics, easy to understand and read. I think that there is the possibility of creating strictly formal maps, as well as caricatures, and this gives us an advantage as designers of the urban space. Any result is a contribution from our own creative capacity. In the end, we are human and have particular tastes and cultures, not everything should be simplified to data and cold projections.
Taking as a starting point the patented system developed by the Walk Score, the project tries to unfold the data generated for the neighborhoods of Hill District and Hazelwood in Pittsburgh for patterns in the outcomes and possible solutions.