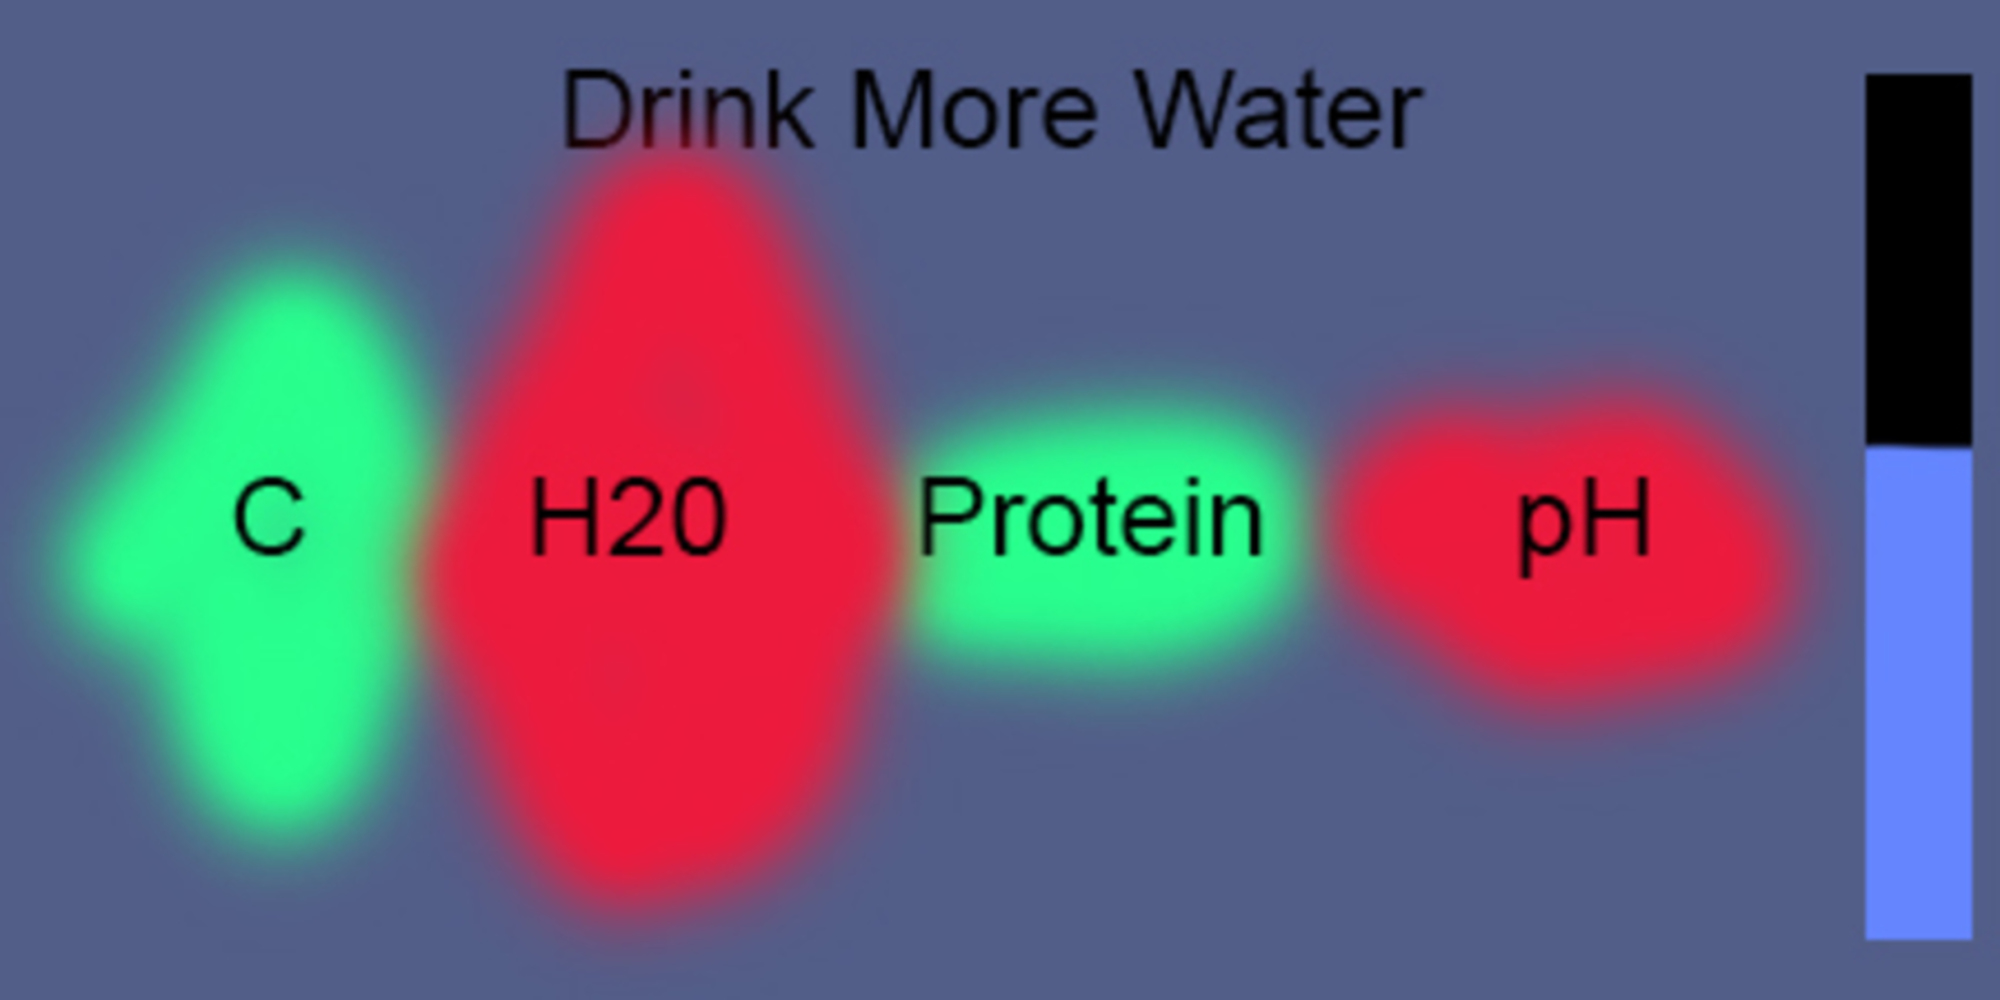
Design: Implement devices in toilets/urinals that test urine each time a person uses it. Once the data is processed, it is displayed on a conveniently located screen either in front of the urinal or to the side of the stall so that it may be easily viewed. Data would include information such as pH, glucose levels, and the specific gravity (More information on urine tests can be found here: webMD Urine Test). This data would then be accompanied with lifestyle suggestions that could help improve health. For example, a person with dark urine that has a high specific gravity is most likely dehydrated and the display could prompt the user: "Drink more water." Also, the interface could alert users when their urine could indicate a more serious health condition such as accumulating kidney stones.
In order to make this system more effective, data collected by the test would be presented in a simple, easy to read, and more embodied way. People aren't going to be in the bathroom for long enough to read an entire summary of their health and traditional graphs and charts are boring to look at and take in. Instead, a color spectrum showing the most out-of-balance levels would be used to display data. People are already accustomed to the idea that green is good and red is bad, so the spectrum would use these colors to show approximately how off these levels are. That way, a person can figure at out at glance what their health is like and what they can do to improve it. This "approximation" approach also allows less room for any errors and misinterpreting the data since the exact levels are not shown. Along with this, a bar on the side with an overall evaluation on the health of the user based on their urine would be given.
Privacy is also an important in this scenario since it's revealing personal information in a very public setting. To help protect privacy, the screens will only be viewable from the angle of the user and weight/motion detectors will be used to reset the display once a person walks away. None of this information will be saved or used for any purpose besides benefiting the user.
This design incorporates the principles of graphical excellence as described by the readings. It shows the data in a way that user focuses on what is being presented rather than how it's being presented. It has a clear purpose of showing the results of the urine test without trying to skew it or extract too much meaning from it.
Goal: The goal of displaying this data to users is to help people make small decisions that can positively affect their lives. Most people wouldn't be able to understand the raw transcript of urine tests given to them at the doctors, but everyone can understand the difference between colors and simple sentences.
Feedback: I originally had doubts on whether or not my idea was relevant to the actual assignment. Initially, the idea of a bathroom sensor seems quite ridiculous. However, after talking with my group and TA's, I was assured of the legitimacy of my idea. They helped me focus less on the application level of the concept and rather on how the data was being represented.
Connections to the reading: Like Minard's Napoleon Map, the representation of data I want to implement doesn't use data that is precise or exact. It is somewhat non traditional in this way compared. Also, it is dynamic information that changes from time to time like Viegas's wind maps.