Community Participation Through Text
Made by adobriya
Made by adobriya
Created: December 14th, 2017
Proposal: Participatory Data
Goal: I would like to further my study on Housing conditions in the Hill district that I worked on in module 2. Having gone through the 'responsive city' reading which spoke about how in New York city, researchers got together to find out the the flaws in city's data on vacant lots. This got me thinking, that the data used for my previous study was form 2010 and a lot could have changed since then. The lots could have been reused in some way or the other or might be a place of nuisance in the community.
The aim is to compare the data for vacant lots/units from WPRDC website used earlier and compare it to the City's database of vacant lots/units for sale in the area (using the city's Burgh's Eye View application. Any inconsistencies here can also be verified using google street view.
The participatory part of the project would be giving the local residents an ability to communicate with this project through text MMS. The idea is to have residents sending information about any vacant lots/nuisance properties which can then be added to a growing database which could possibly in the future used by a city.
Data Sources:
Pittsburgh Market Value Assessment data:
Pittsburgh Vacant Units data:
Pittsburgh 311 Data:
https://data.wprdc.org/dataset/311-data (Links to an external site.)Links to an external site.
Burg's Eye View data:
Context:
Chapter two: Networked citizenship, The Responsive City for information on how to integrate city's information with actual status on the ground
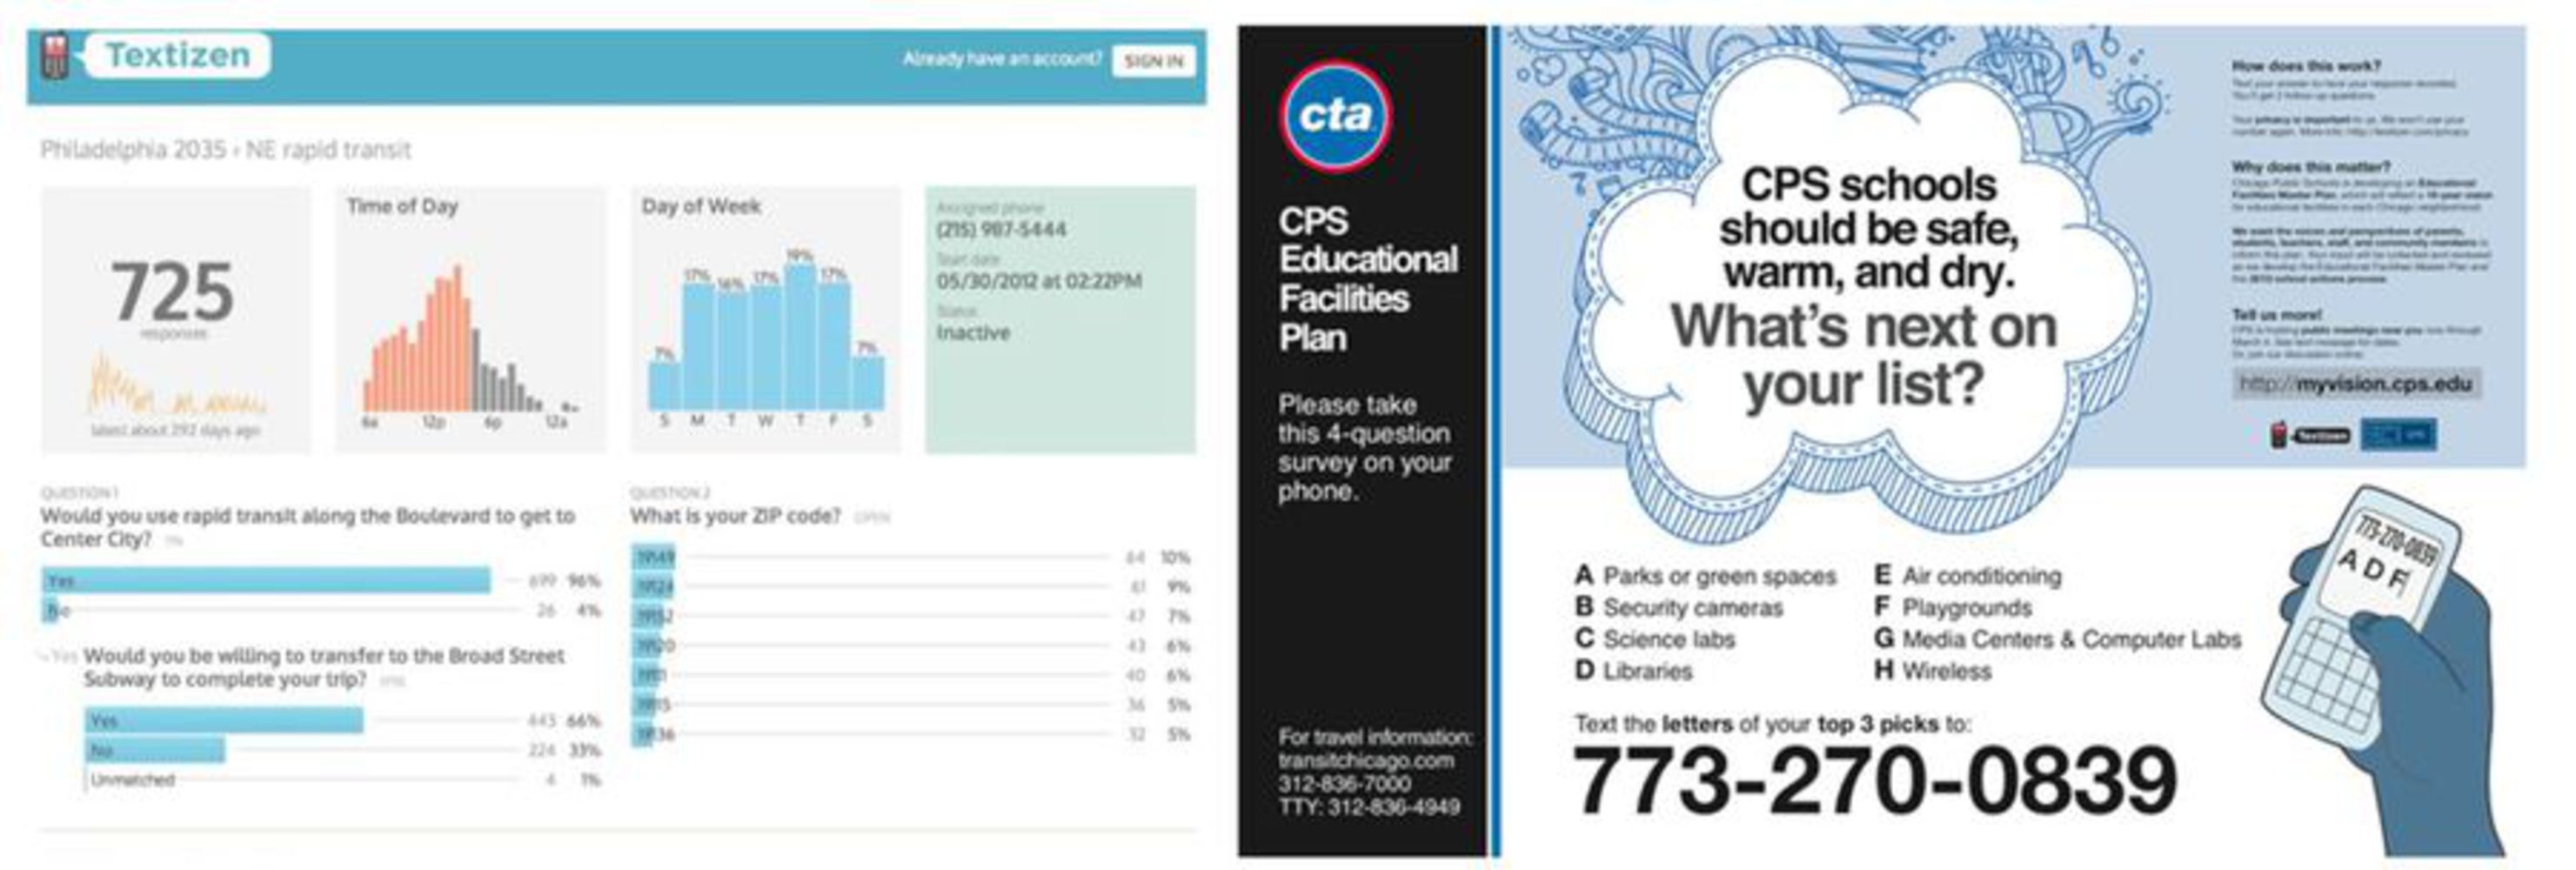
Textizen, on how to make the residents participate
https://www.textizen.com/ (Links to an external site.)Links to an external site.
Burgh's Eye View, on how to display the data in an interactive manner
Analysis
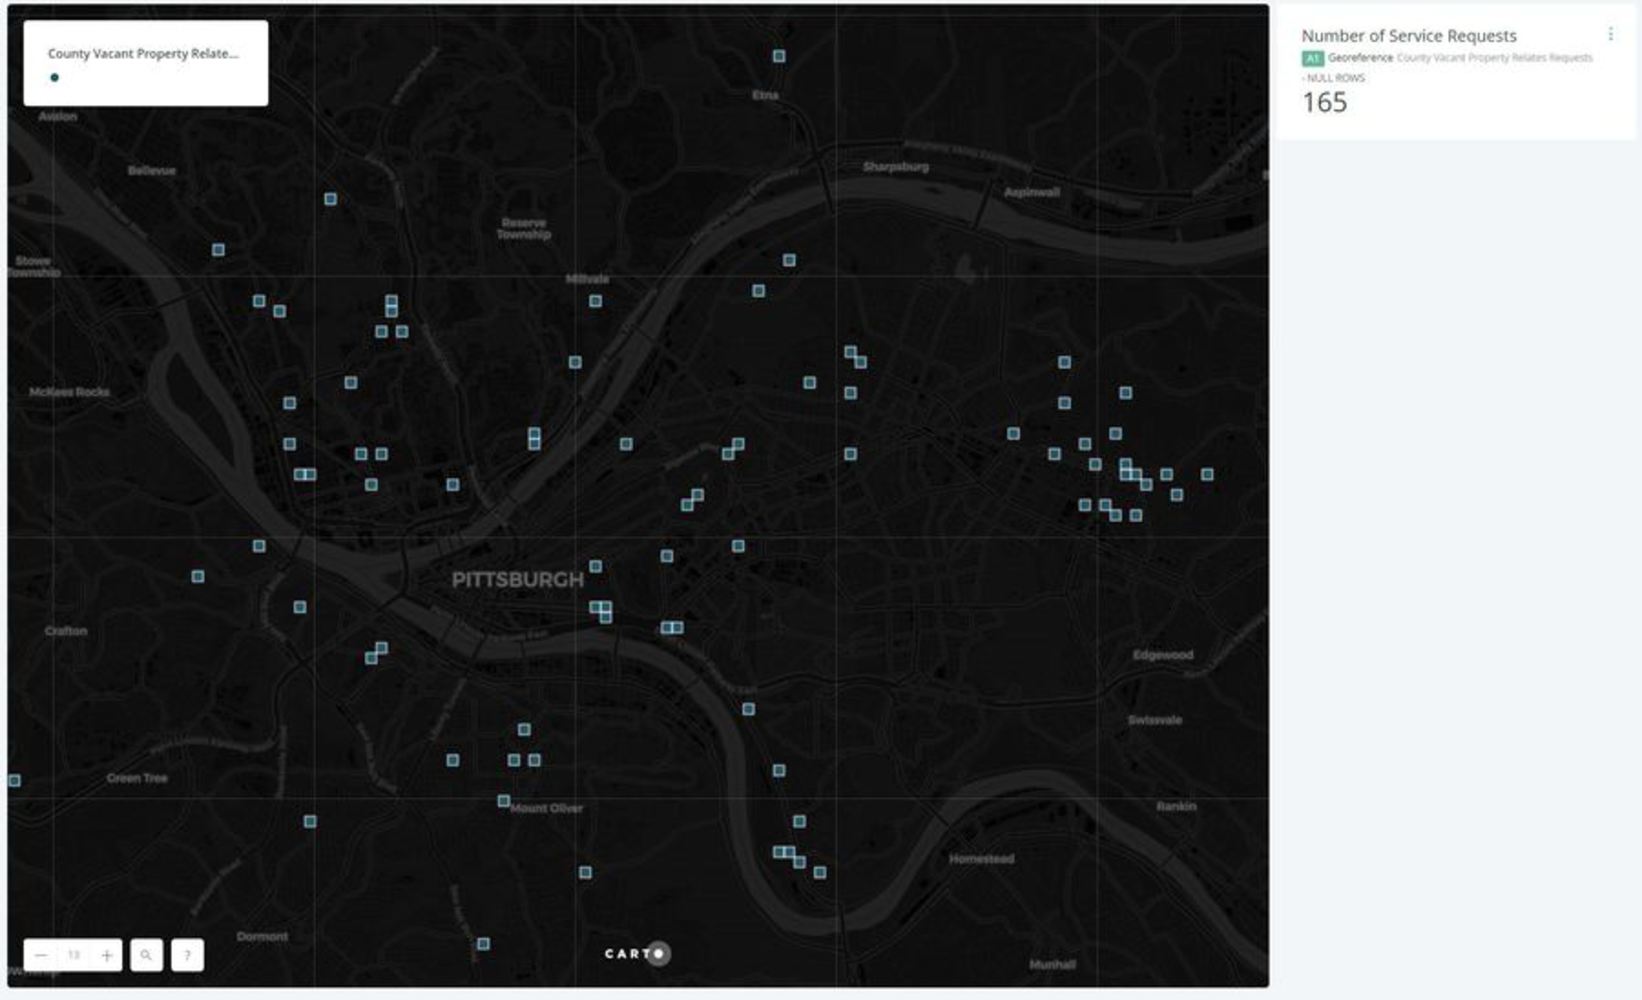
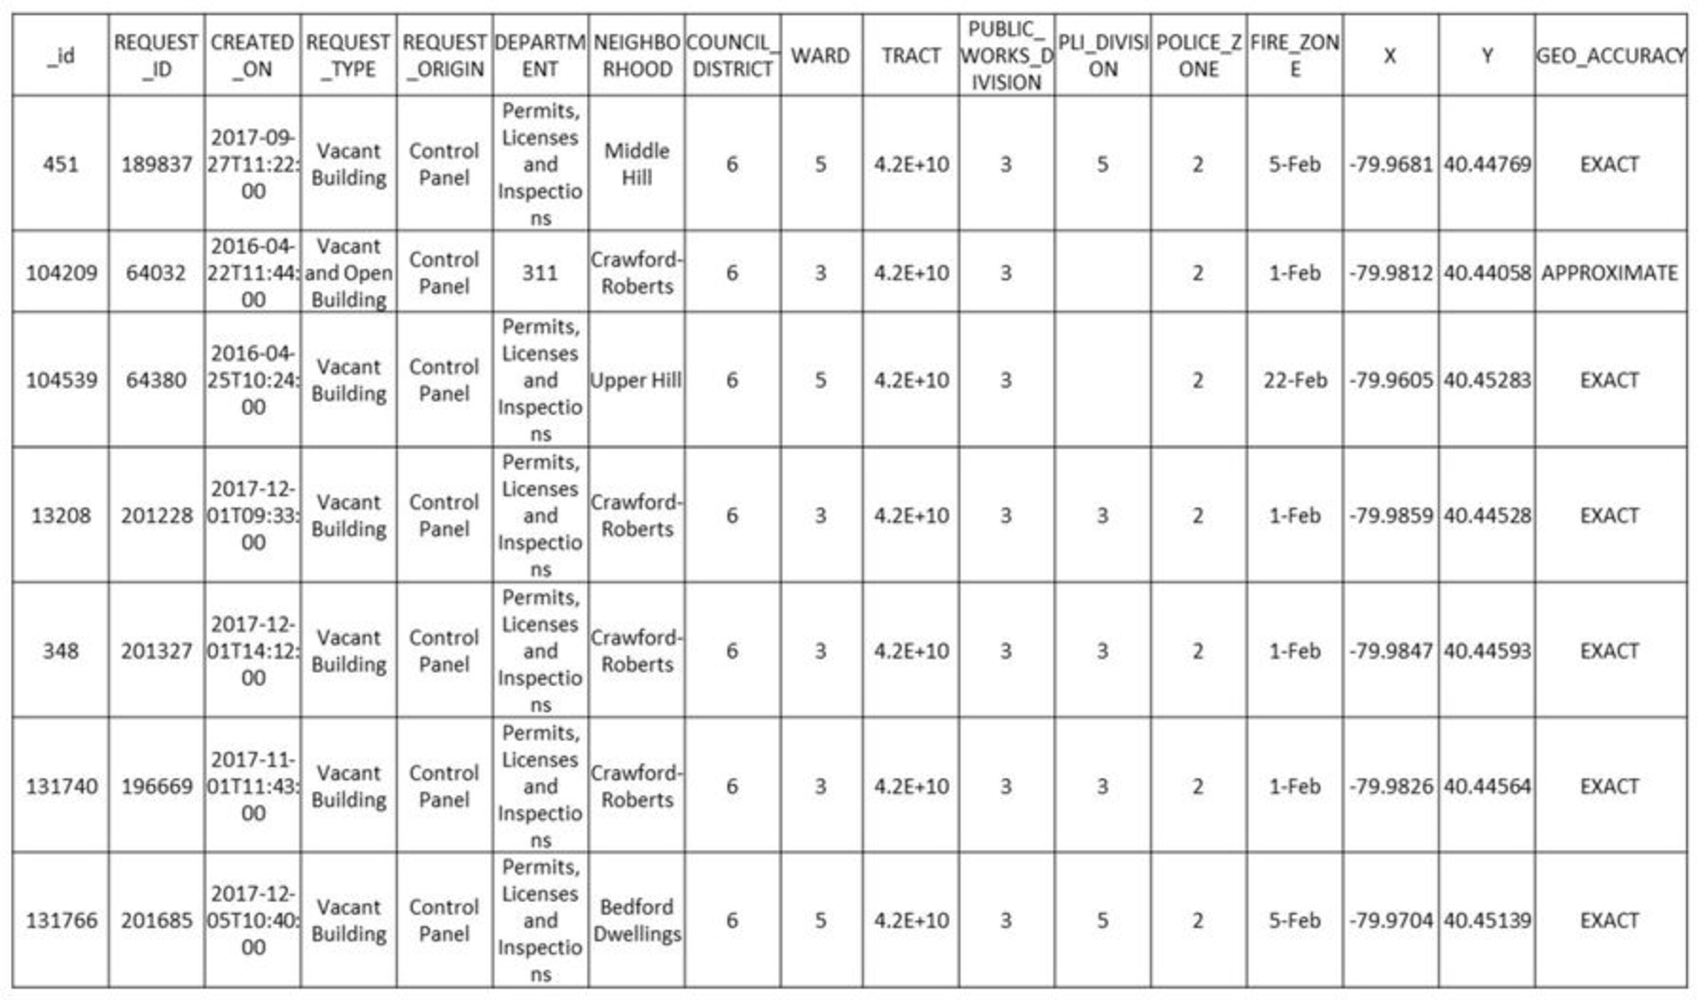
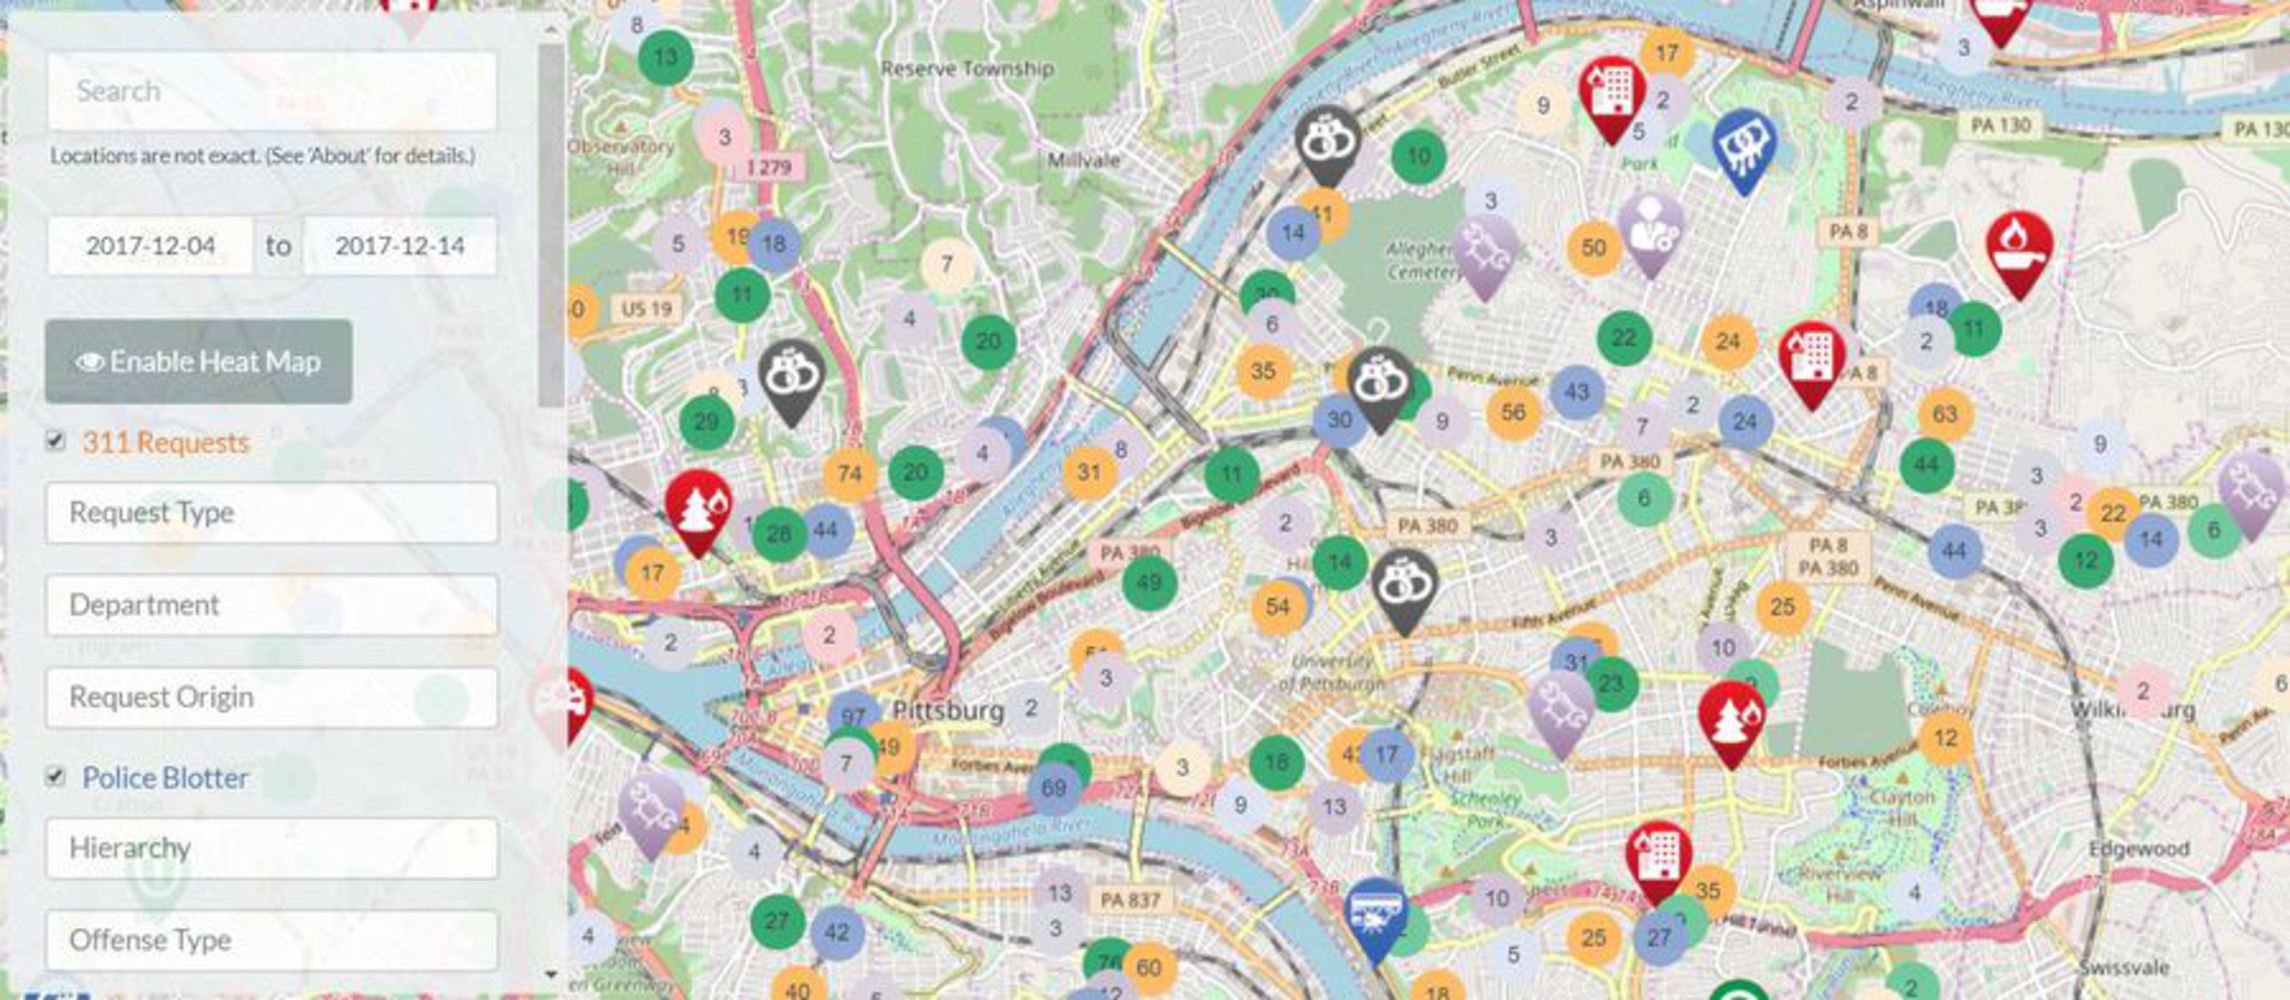
Continuing with the proposal mentioned above, a map of all the County service requests based on vacant properties was developed. The data was obtained from WPRDC website and Carto was used for the visualization. Some significant insights were revealed from this. In module 2, it was shown that the Hill District had a high proportion of houses in poor condition. However, this new map showed just 8 Service requests made in 2017.
This data had to be Geocoded based on address. As the addresses were in two different columns, they were first ‘merged’ before a complete street address was formed to be used in geocoding.
This led to a thought about looking at channels by which these property requests are reported. A quick research brought the 311 system in to the picture. Now, taking the 311 request data from WPRDC website and filtering it first for 2017 and then for vacancy related requests, it was seen that 173 requests were made in total in this category.
Insights:
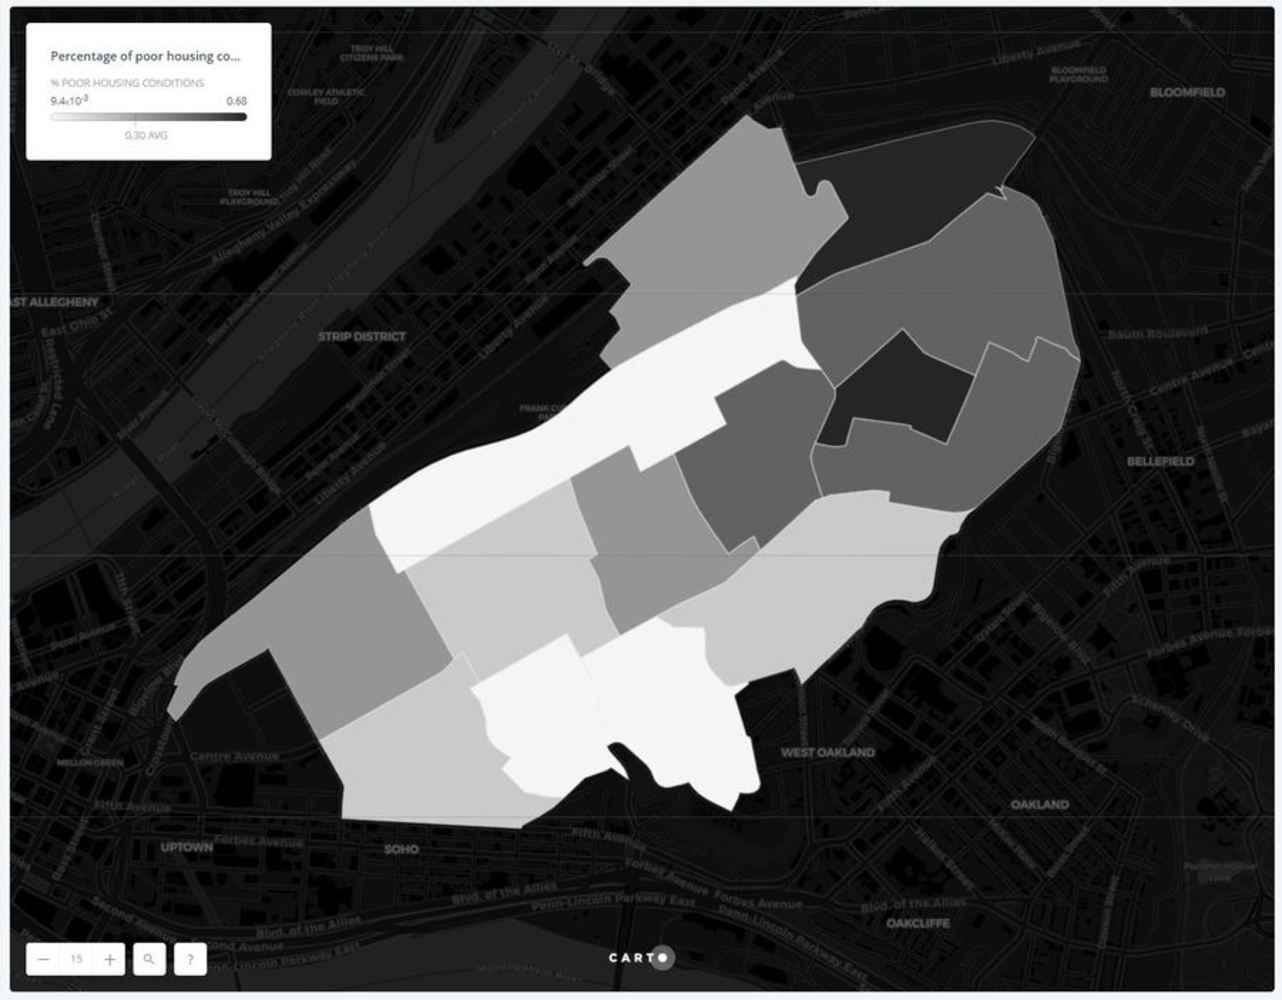
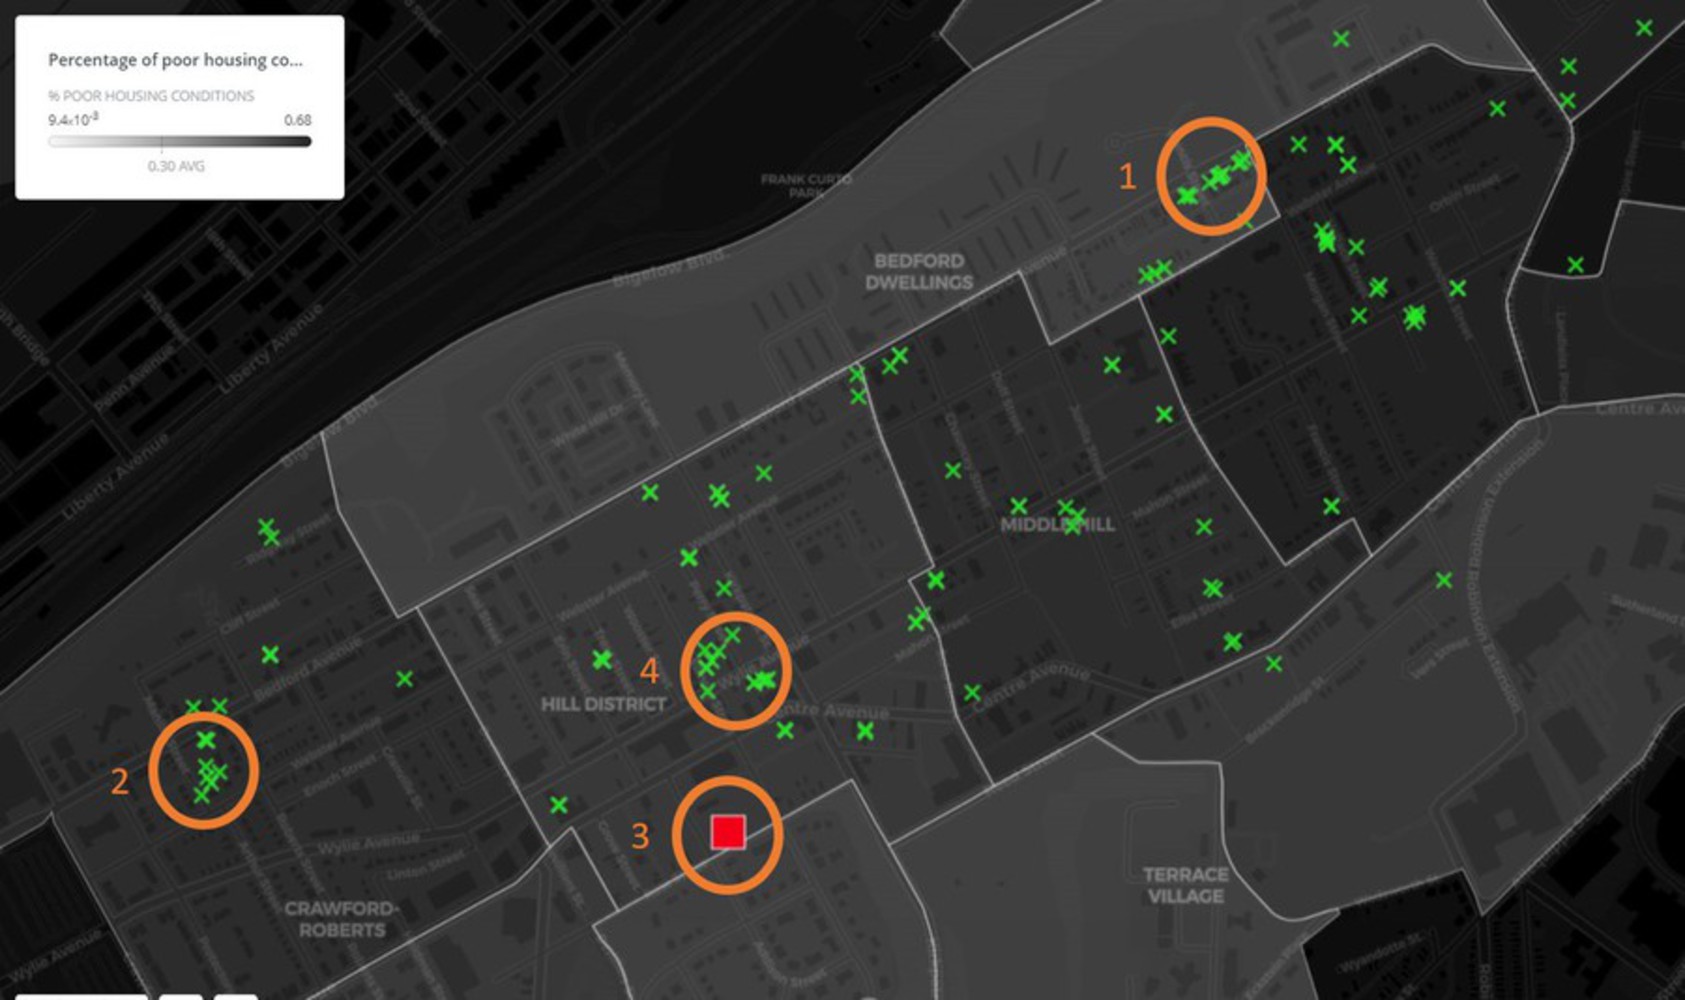
Now taking the above two data streams and overlapping them on “housing conditions in hill district” map in the background, gave us a clear picture of the discrepancy in the transfer of there requests from one authority to the other. The 311 is a database involved by public and in itself is an engagement mechanism. However, there seems to be a gap between this system and the data available with the county. This means that there is a problem with the way the system is set up to engage the residents.
Additional Insights:
1. As can be seen from the above graphic, a majority of the 311 requests are from the block groups with known high concentration of poor housing conditions. This will be helpful in targeting residents and these groups can be targeted first.
2. There were multiple service requests for the same properties through the year. This shows a lag in the filing of requests and action being taken.
Sources:
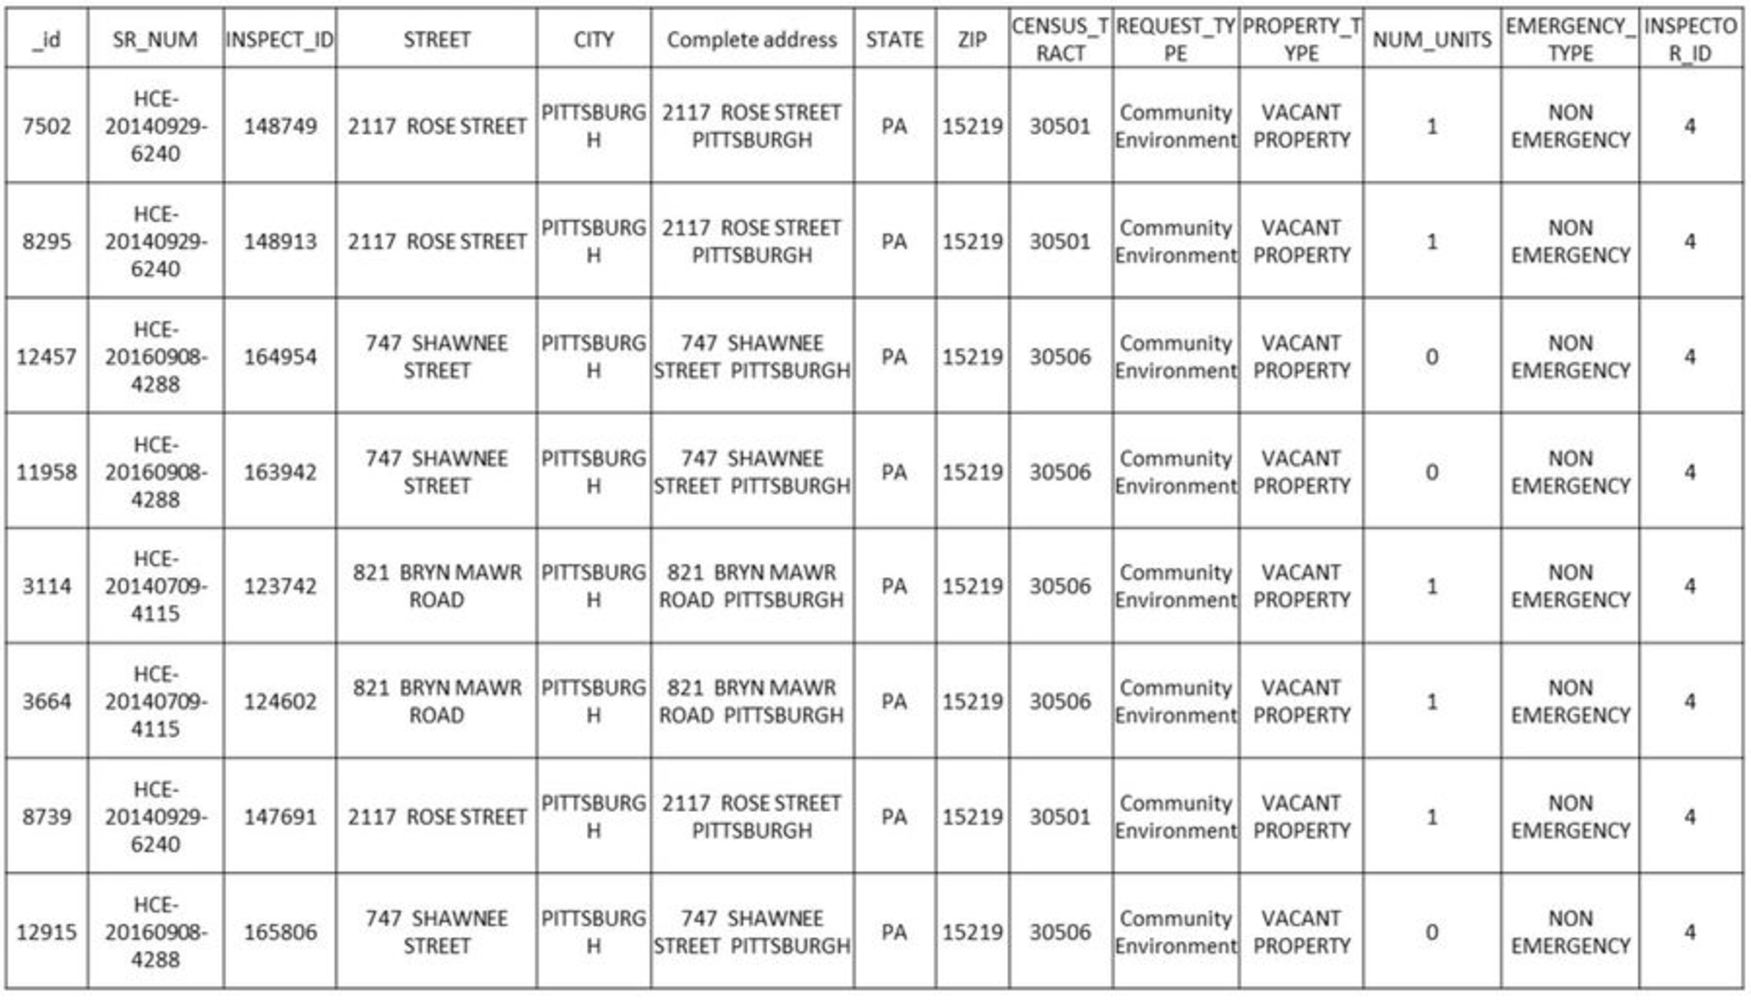
1. For data on county service requests regarding housing issues: Allegheny County Housing and Community Environment Inspections – WPRDC (https://data.wprdc.org/dataset/housing-and-community-environment-inspections)
2. For data regarding 311 requests: 311 Data – WPRDC (https://data.wprdc.org/dataset/311-data)
3. For data regarding housing conditions in Hill District : Market Value Analysis - Urban Redevelopment Authority (https://data.wprdc.org/dataset/market-value-analysis-urban-redevelopment-authority)
Case Study Analysis
Let us now look at some peculiar cases form the analysy
Case study 1
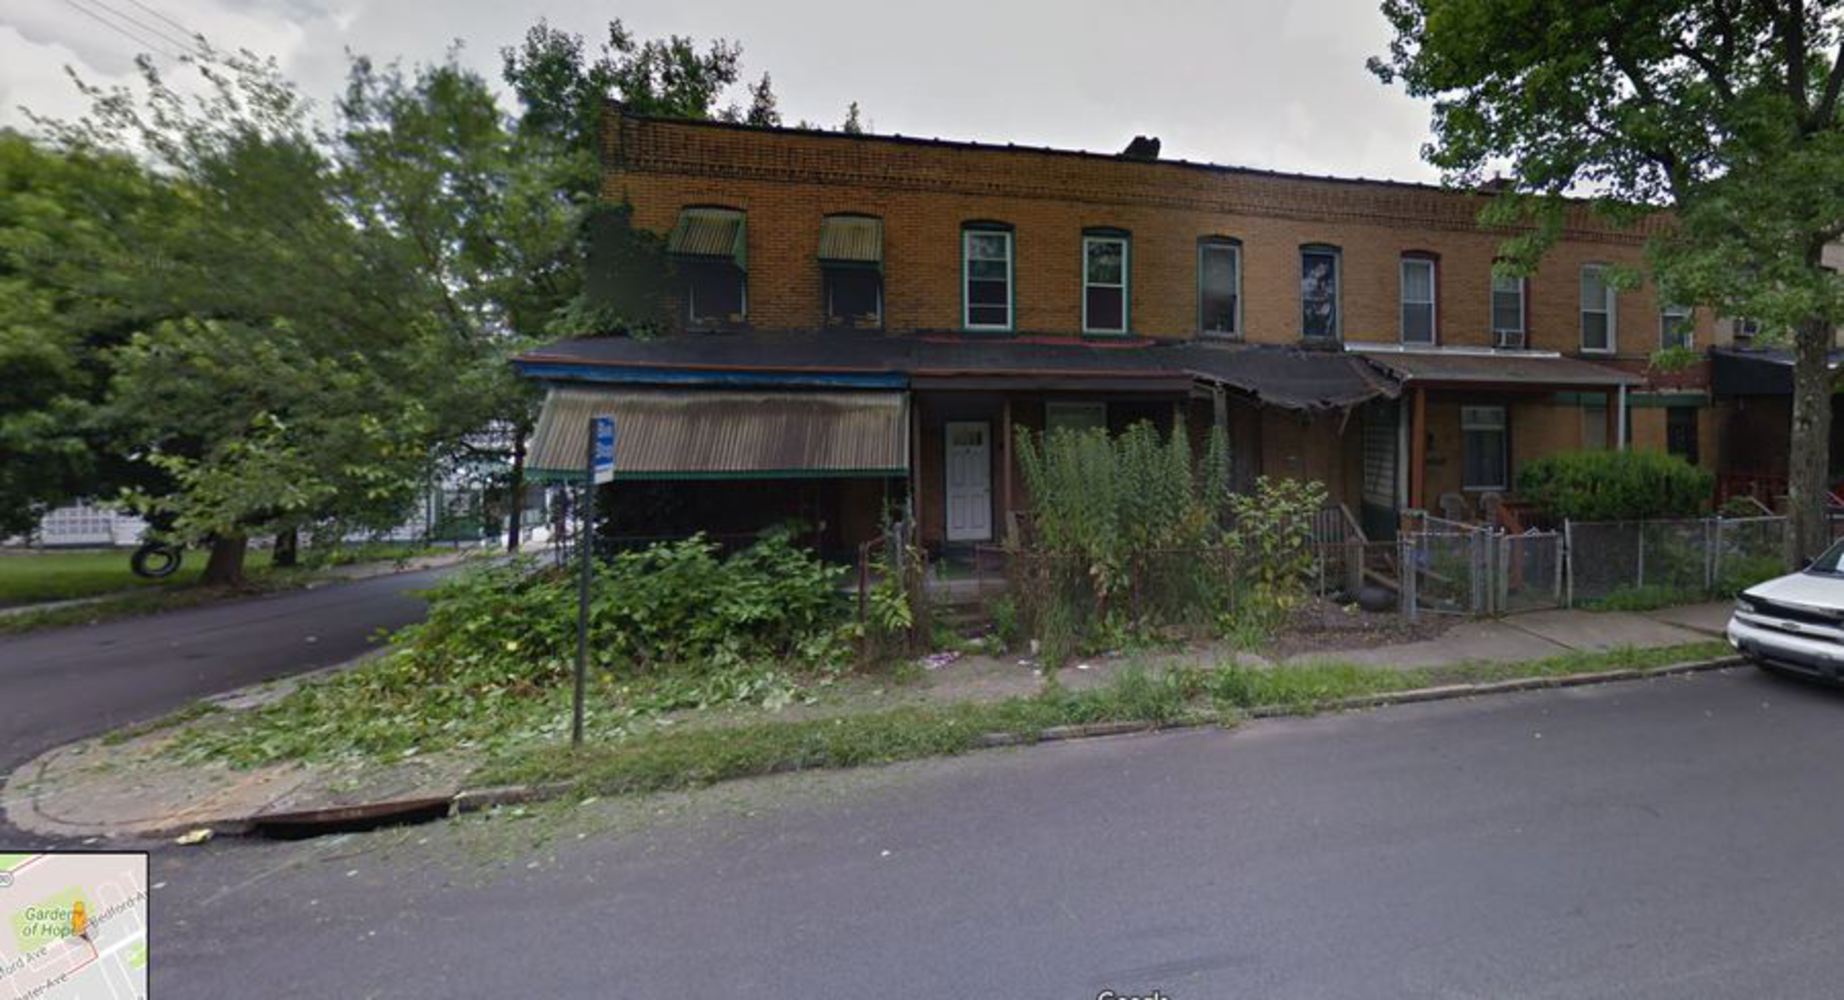
As can be seen in the above image, the case marked 1 seems interesting as it forms almost a linear cluster of requests. These requests also seem to over lap. The following three images talk about this cluster.
The first images shows a corner unit which is clearly vacant and adjacent to it is an occupied unit. this explains the reason for multiple requests as the vacant unit is a safety hazard for the people next door. We can also see the porch roof caved in.
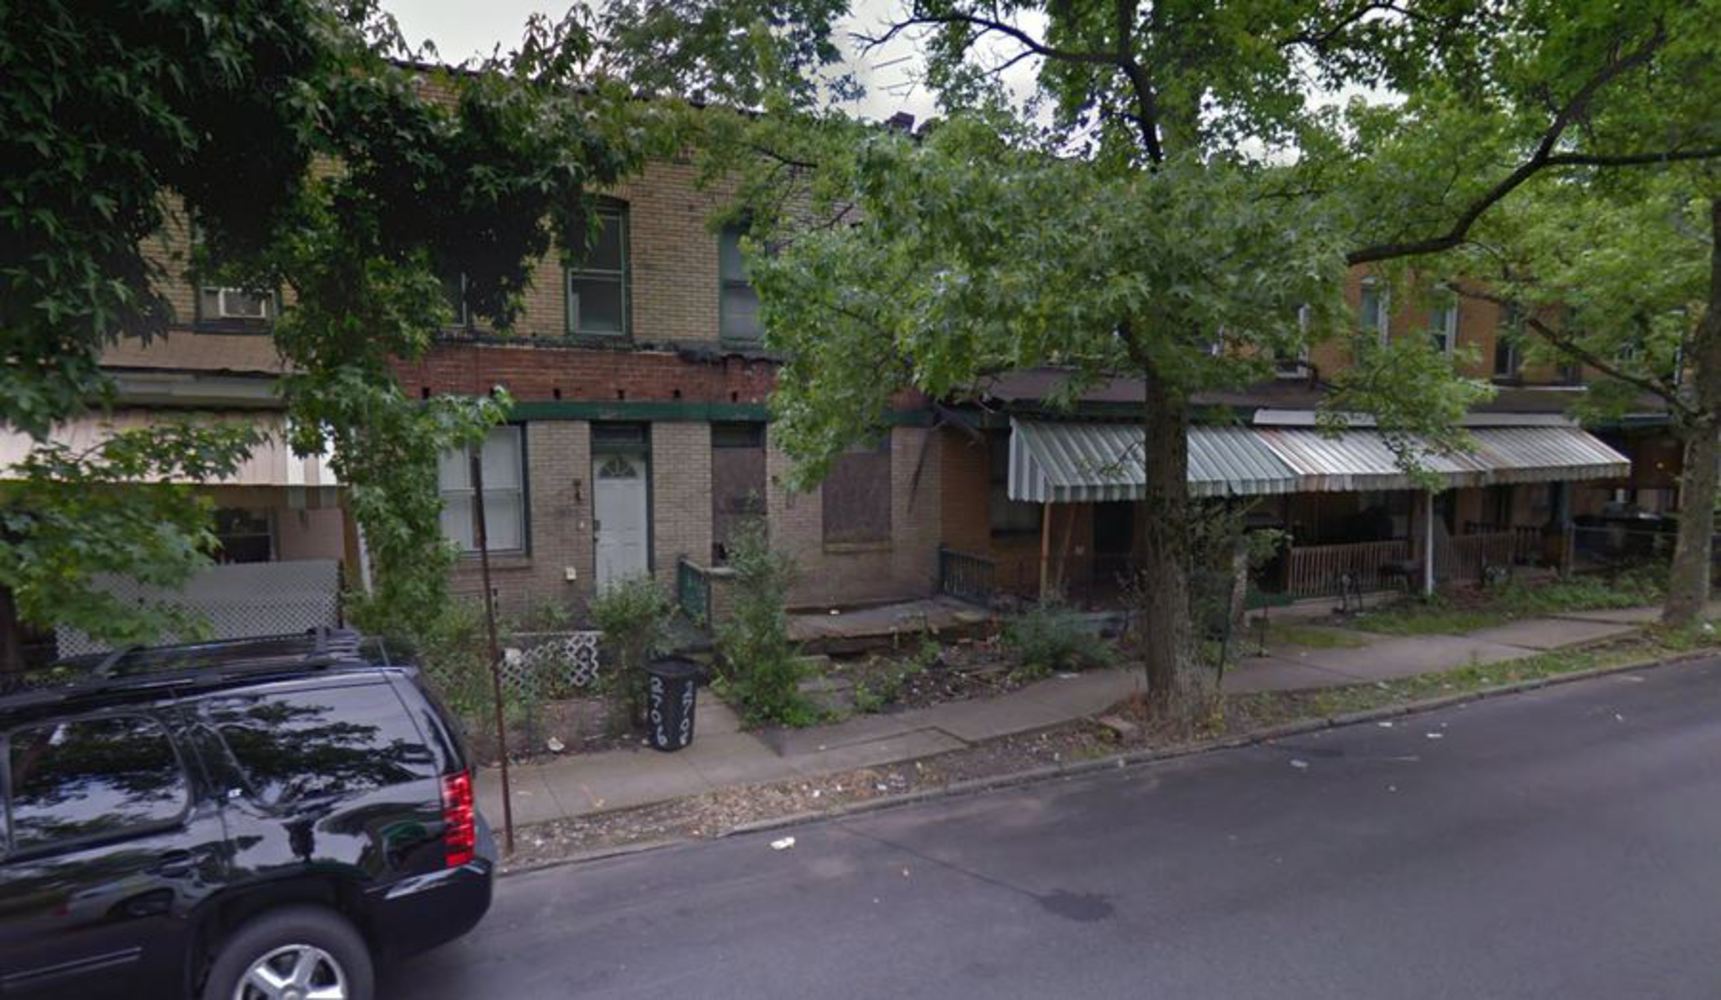
The second image is of another unit in the same row of houses. The reason for the repeated requests seems to be the same as the adjacent units are occupied, there might be nuisance related issues.
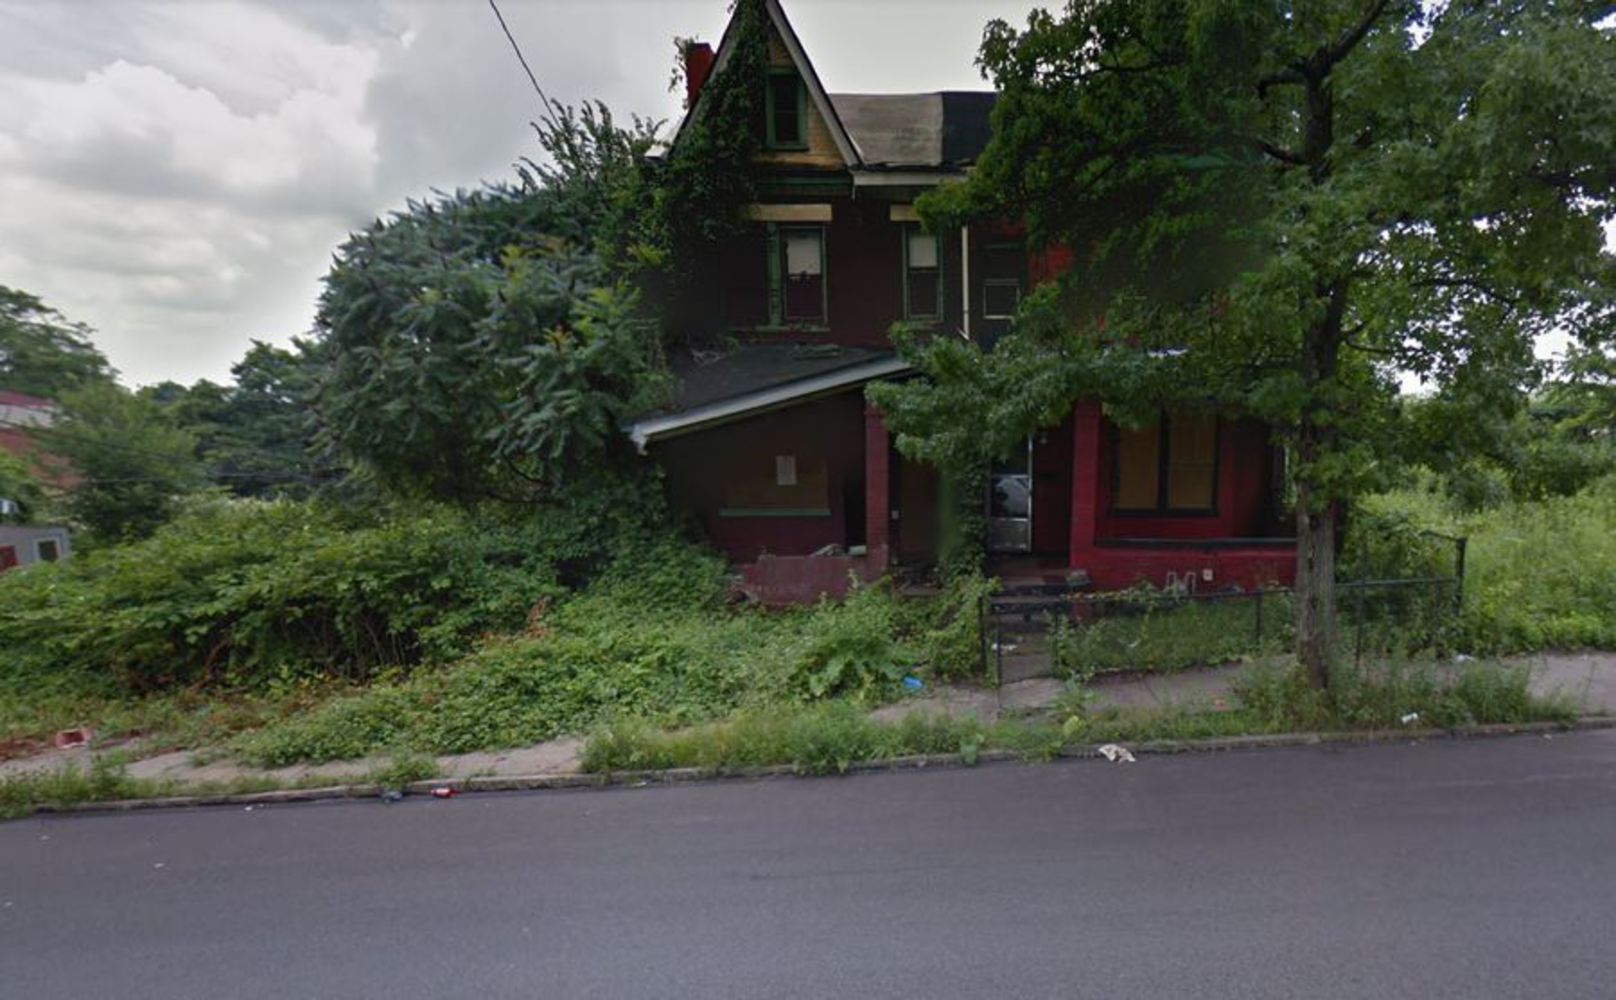
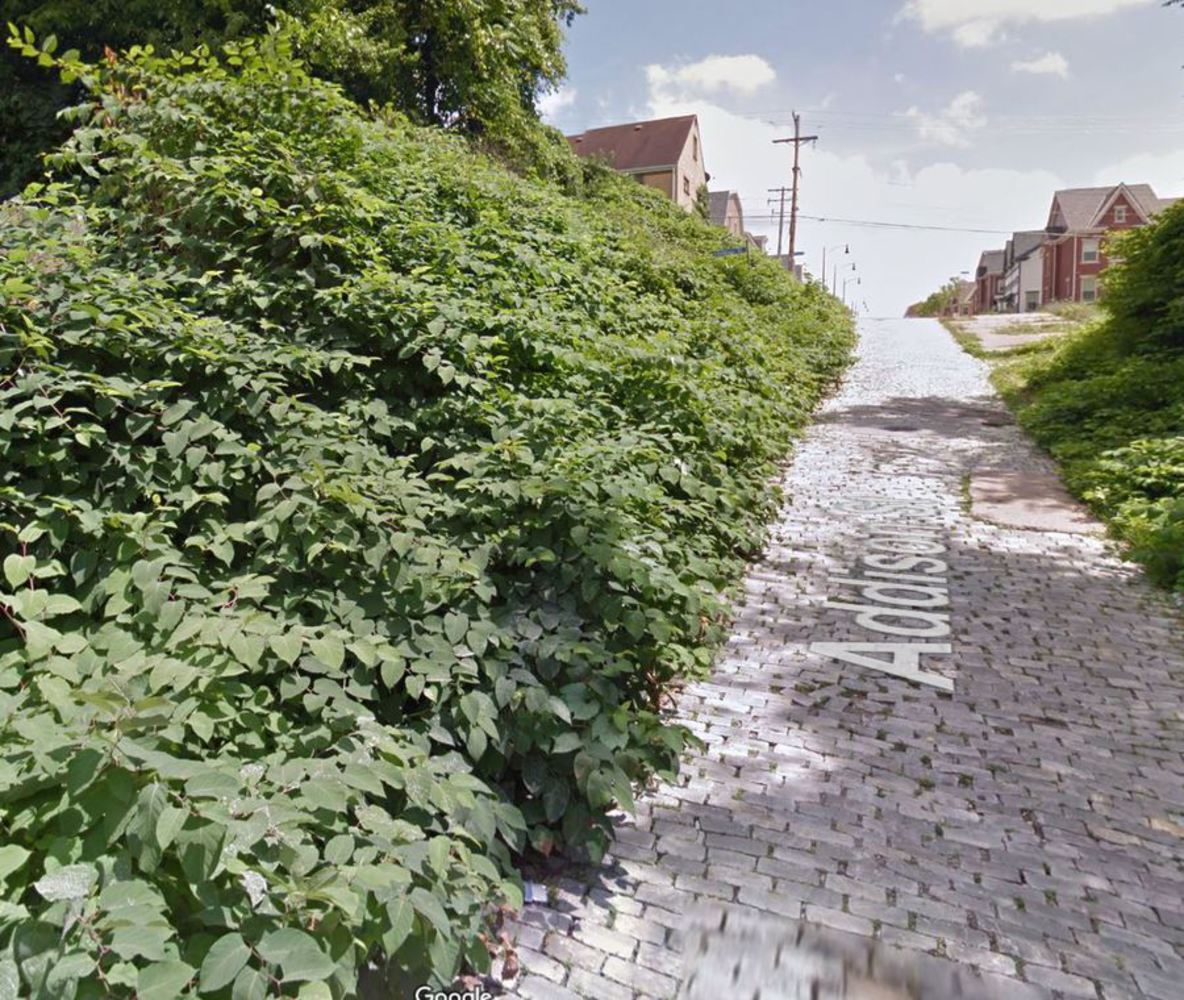
The third image is of a separate unit next to the long row of houses. As can be seen, the porch and part of the roof are caved in and this poses a structural hazard to anyone near it. There is also an overgrowth of shrubbery and that is not good for the structure as well.
Case study 2
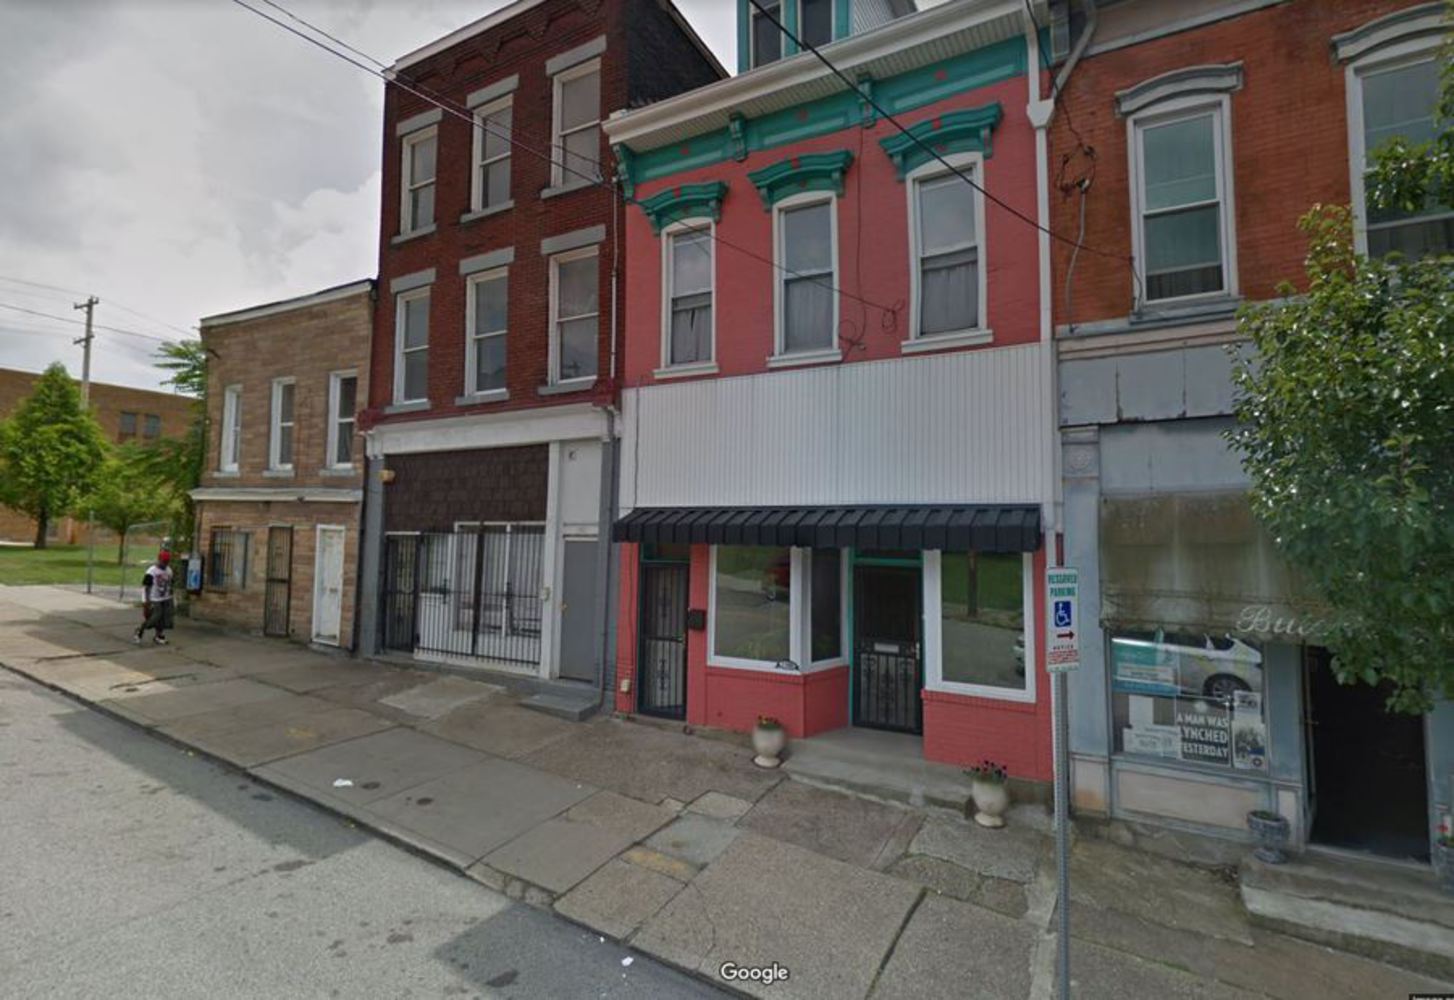
This is the case marked 2 in the earlier image showing all the cases. As can be seen the middle unit (light pink one) seems to be vacant and the door is also boarded up. This unit has been a hub for multiple 311 calls. Possible explanation could be nuisance activities or people squatting.
Case Study 3
As can be seen in the image below, this is case number 3 which was resolved by the county. There used to be a caved-in house towards the left of the image where we can see large shrubbery. This is at the boundary of an affluent neighborhood - Terrace Village which has seen quite a bit of development recently. This could also explain why this request was one of the few that got resolved.
Case Study 4
This image below shows case 4. As can be seen in the image, the vacant property is long gone (either rehabbed by owner or the city) but this information does not show up in the county records. Looking at the carto illustration earlier, it can be seen that there were a lot of requests from this property and the problem has seemingly been resolved.
As we see from the above analysis, clearly there is a gap in information sharing between the community and different civic entities. Even though the 311 requests are being made, there is only a 4.6% response rate from the civic bodies. This calls for community intervention in the matter.
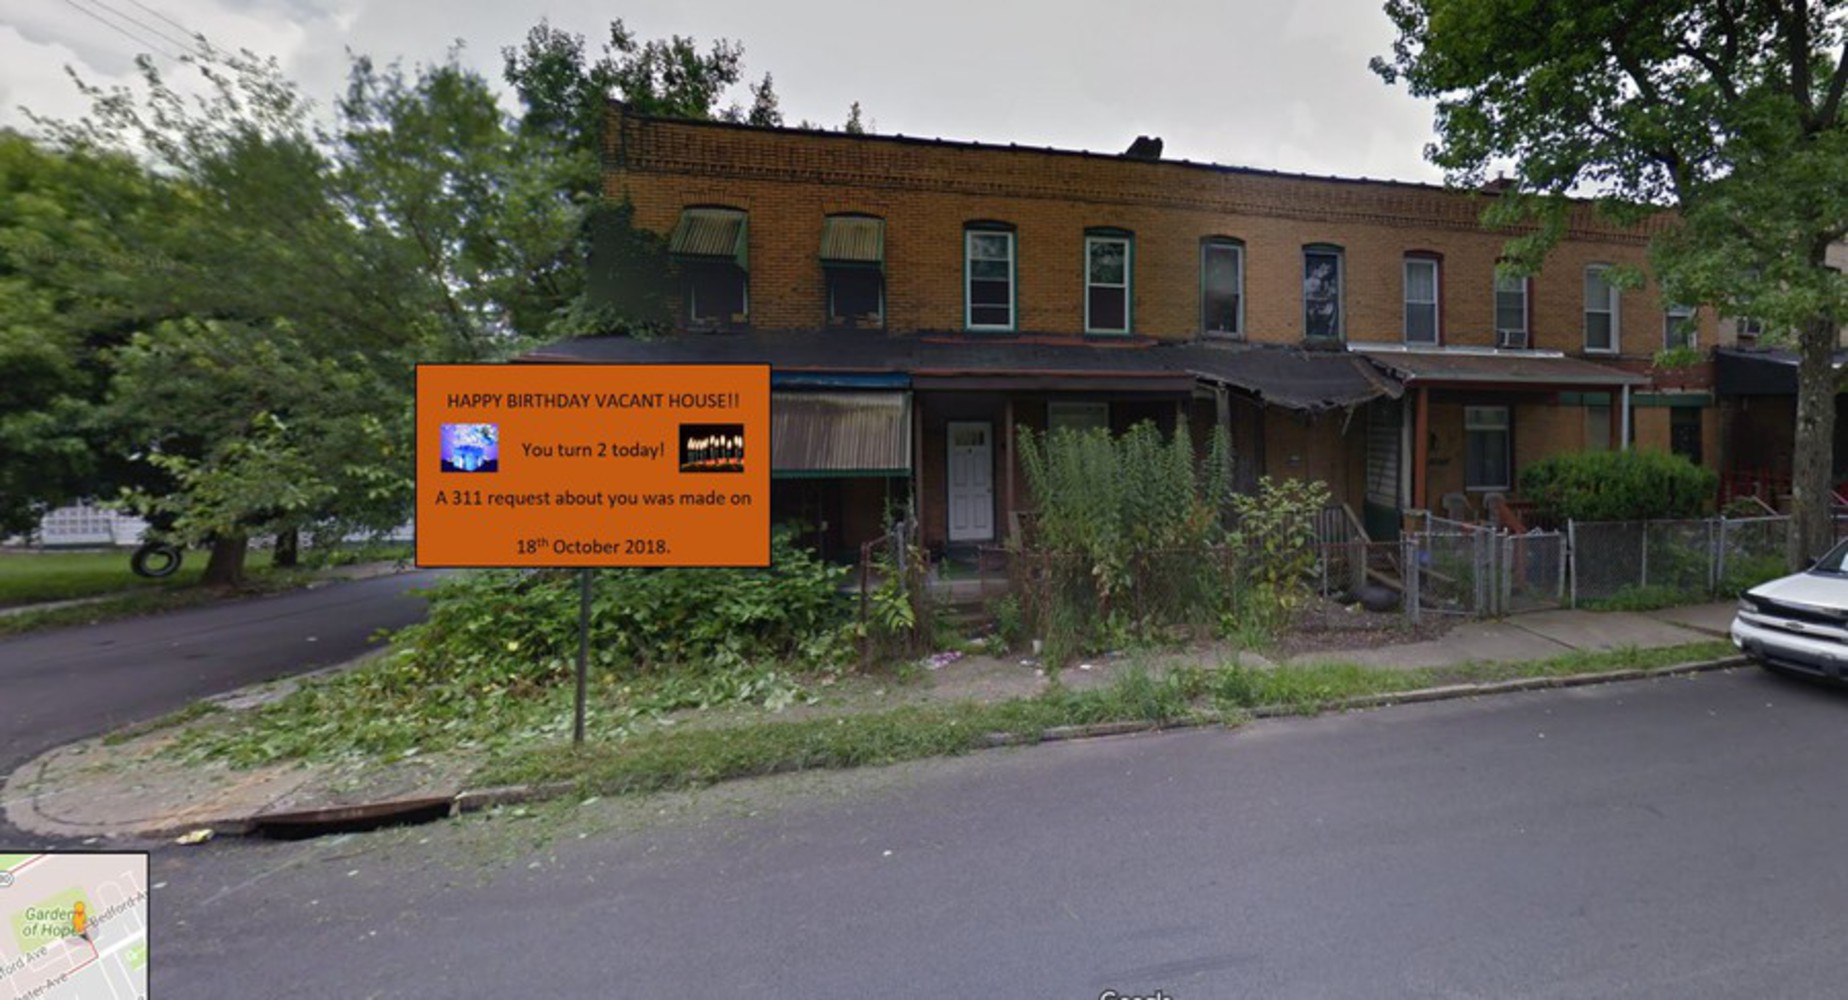
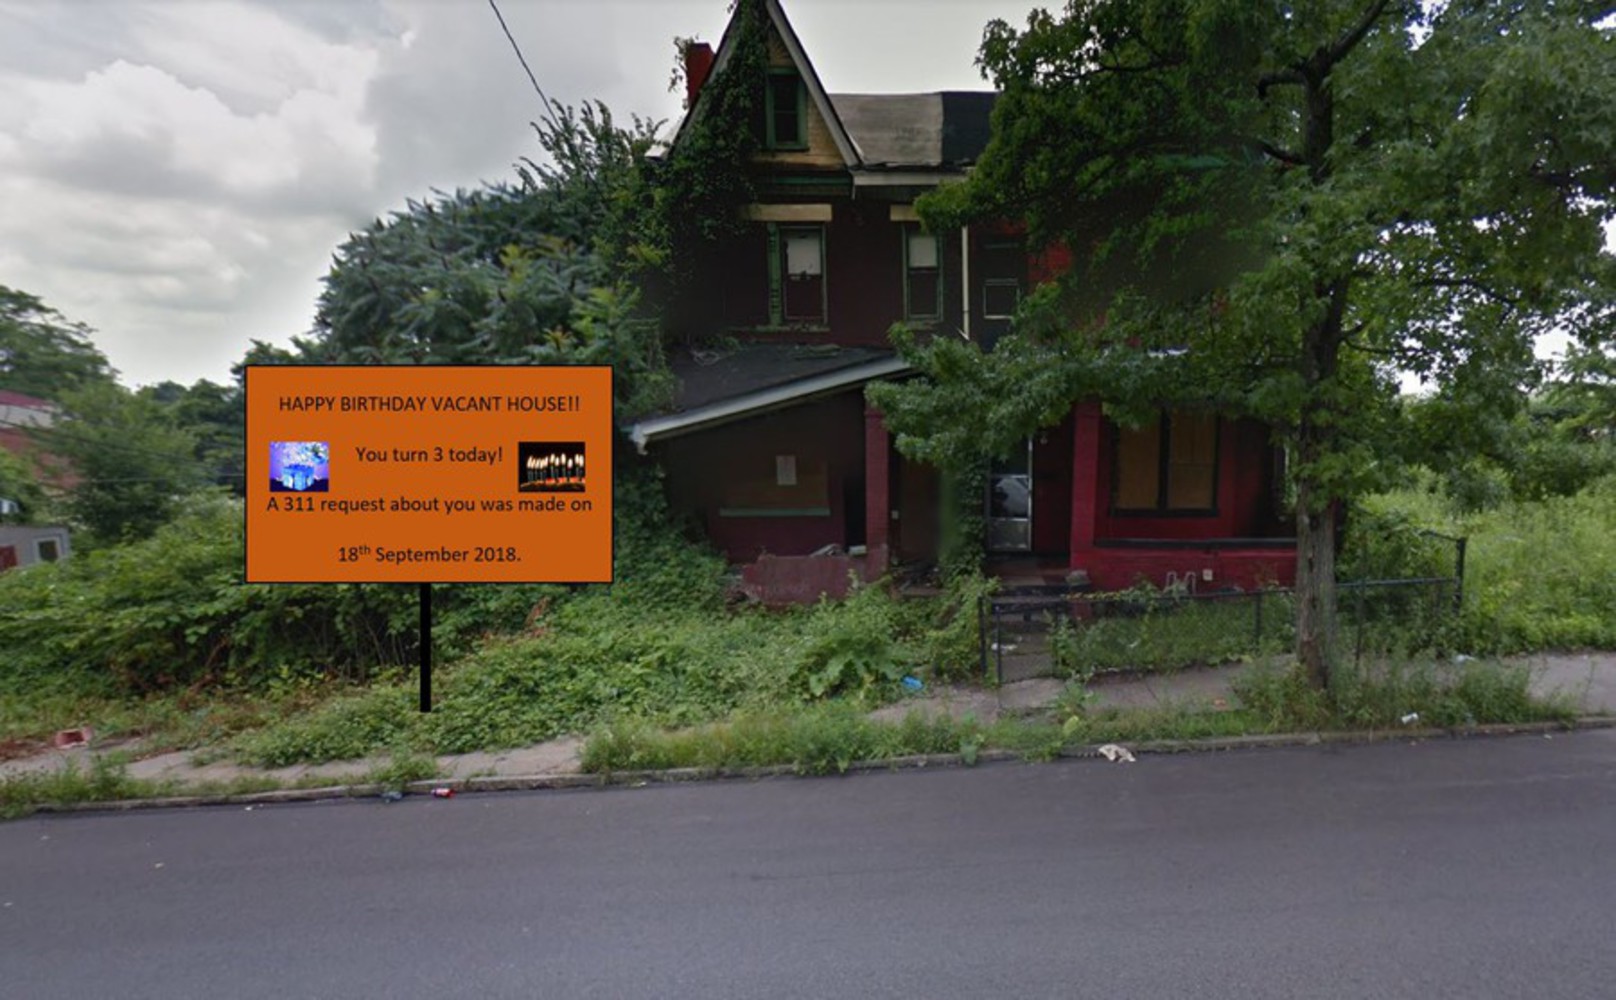
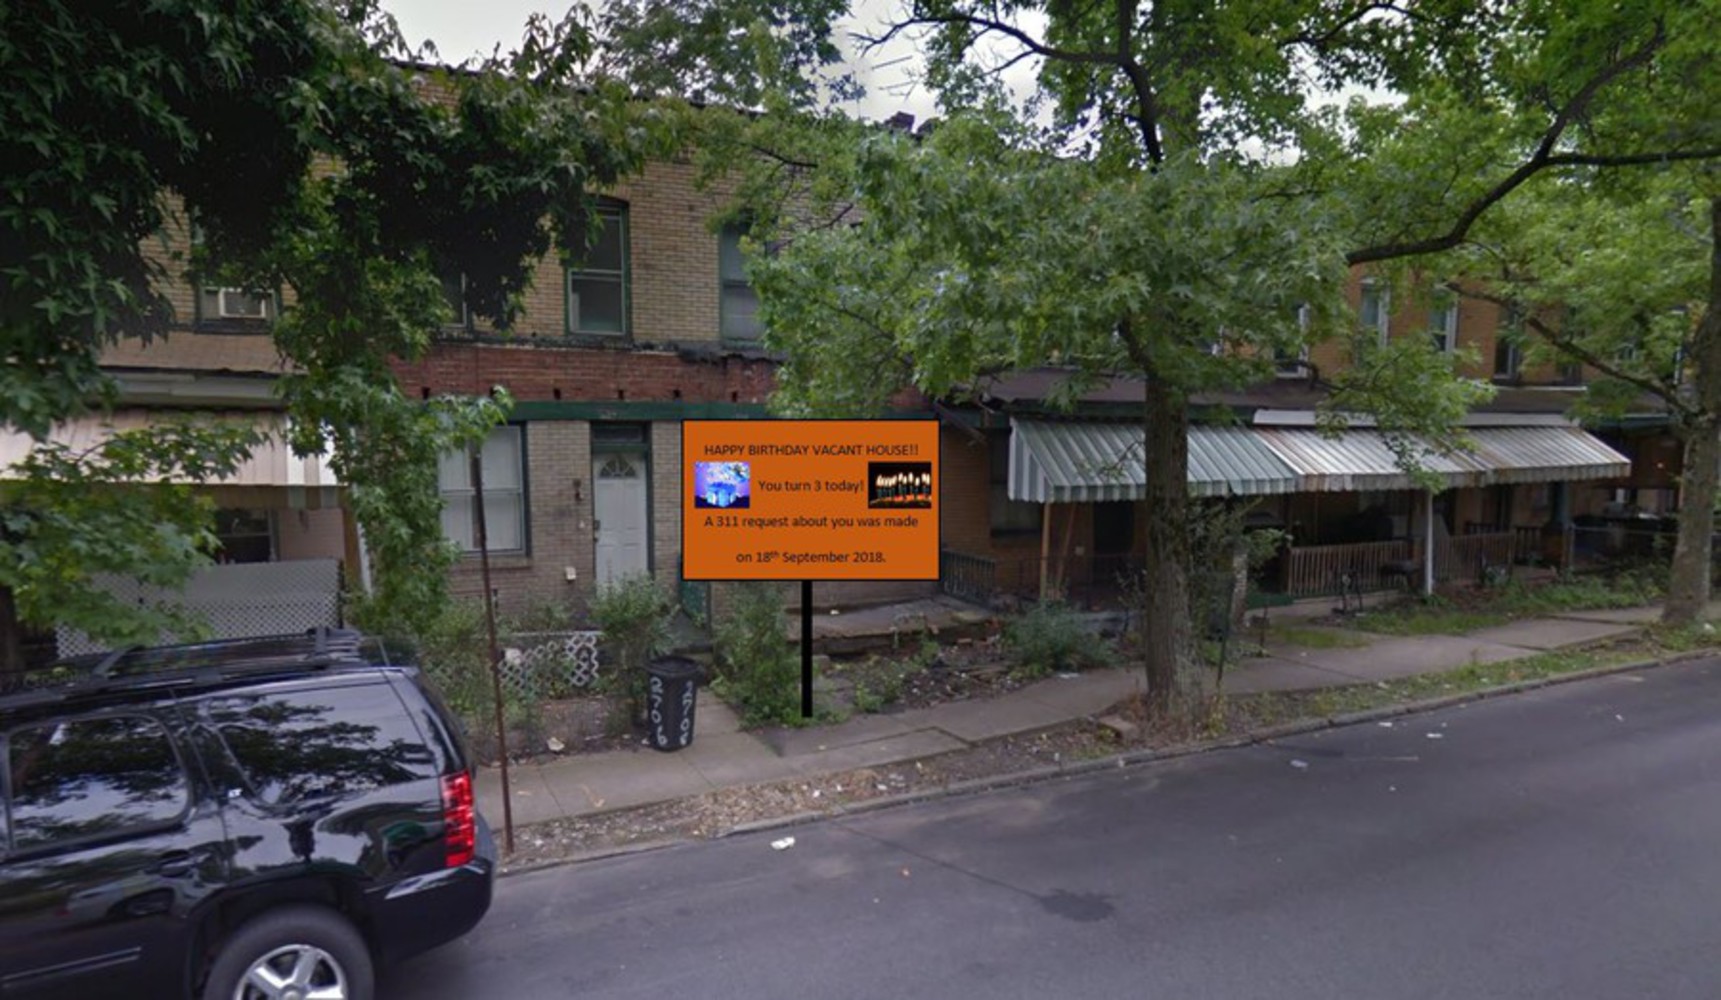
Inspired by an article from Jackson, Mississippi (http://www.wpxi.com/news/pothole-gets-birthday-celebration-after-citys-inaction/247218033) I would recommend the idea of a 'Birthday Celebration' of the request made on a monthly basis. This would be done on 4 feet by 3 feet bill board preferably.
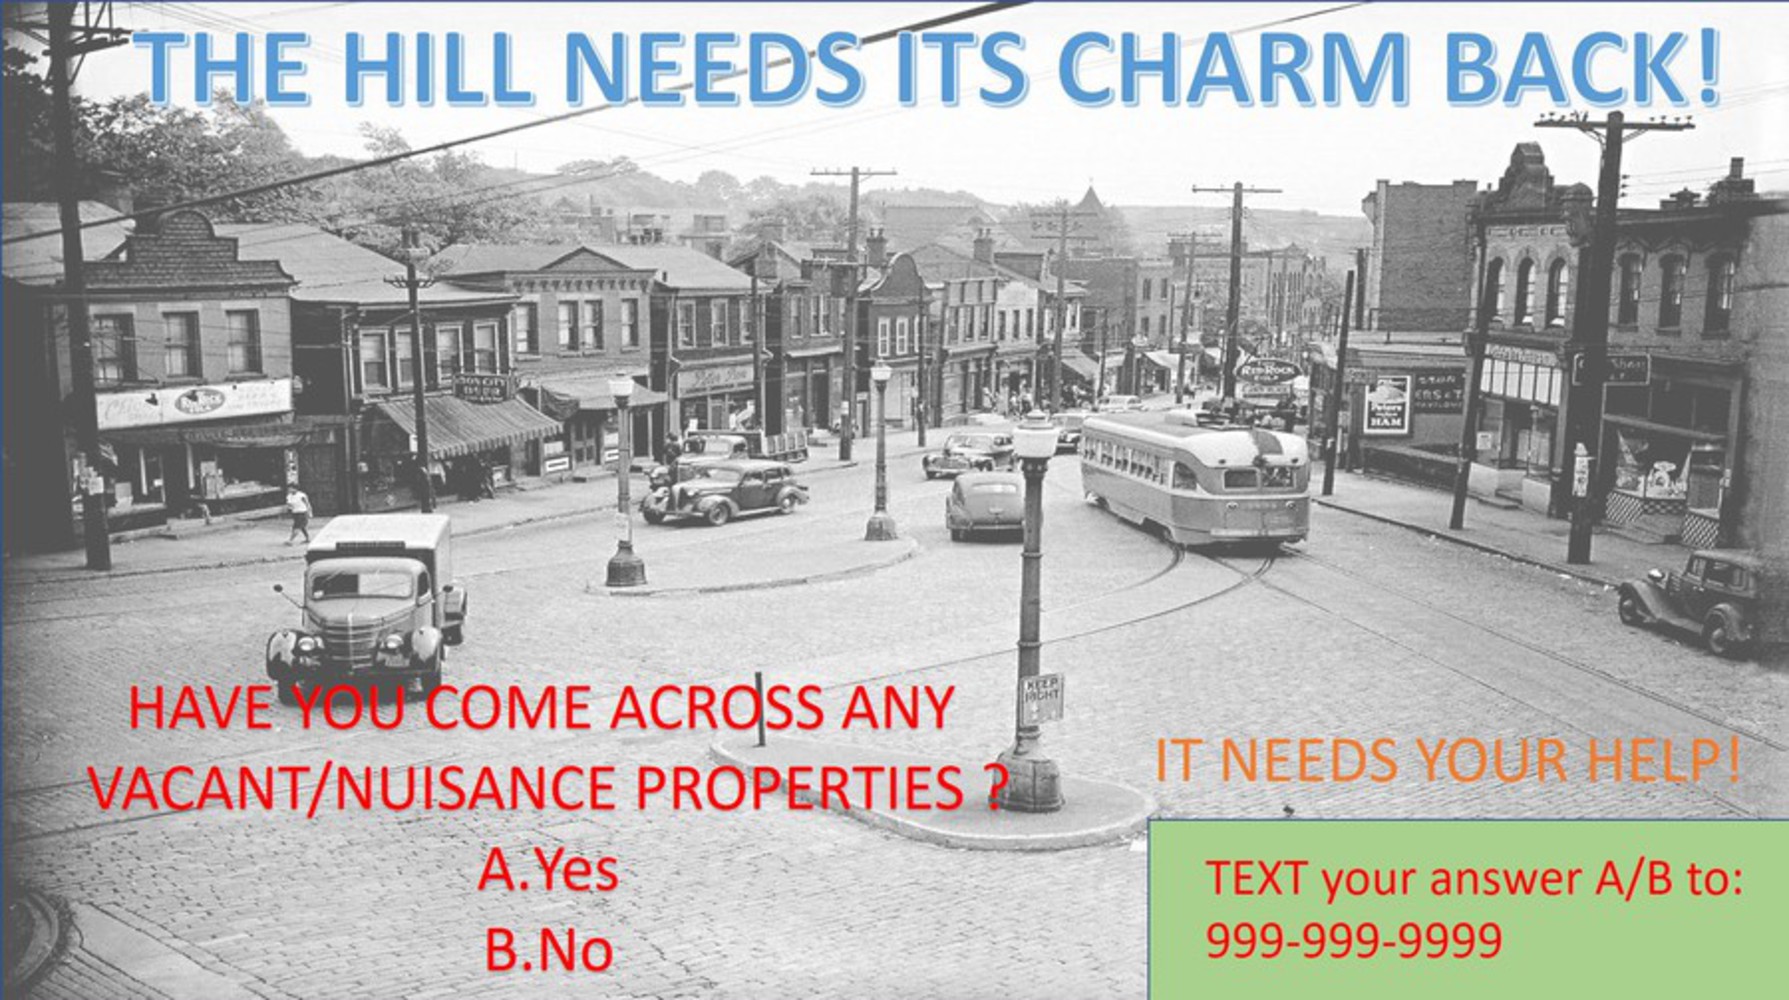
The below images show a rudimentary image of how the boards might look. This hopefully will get the city's attention with backing from the press and social media. These boards would be placed in front of vacant properties in consulting with the Hill District Consensus Group.
Based on the insights gained and the cases studies, a few strategies can be recommended. Their details are as follows:
Data Visualization
1. All the 311 data is available online, but as we have seen from numerous case studies before, it is of no use to the general public before it is processed. Therefore, an online system is needed which shows all this data. Burgh’s Eye View already shows the 311 data. However, based on the differences that were observed in the data between the city 311 and county resources, an integrated system is needed which takes up the 311 requests and updates in both the city’s and county’s databases.
2. This could later also involve a feedback system, where the requests that have been attended to are updated. This can be done to look into recurring problems and these can then be taken care of separately.
Digital Data Collection
1. As we can see that the 311 data has some discrepancies with county data. Also, there might be some hesitation from the community to provide information over call, it would be recommended to have a text based system like ‘textizen’ to make people more comfortable. Also, text would be easier to follow up and gain more information on the issue.
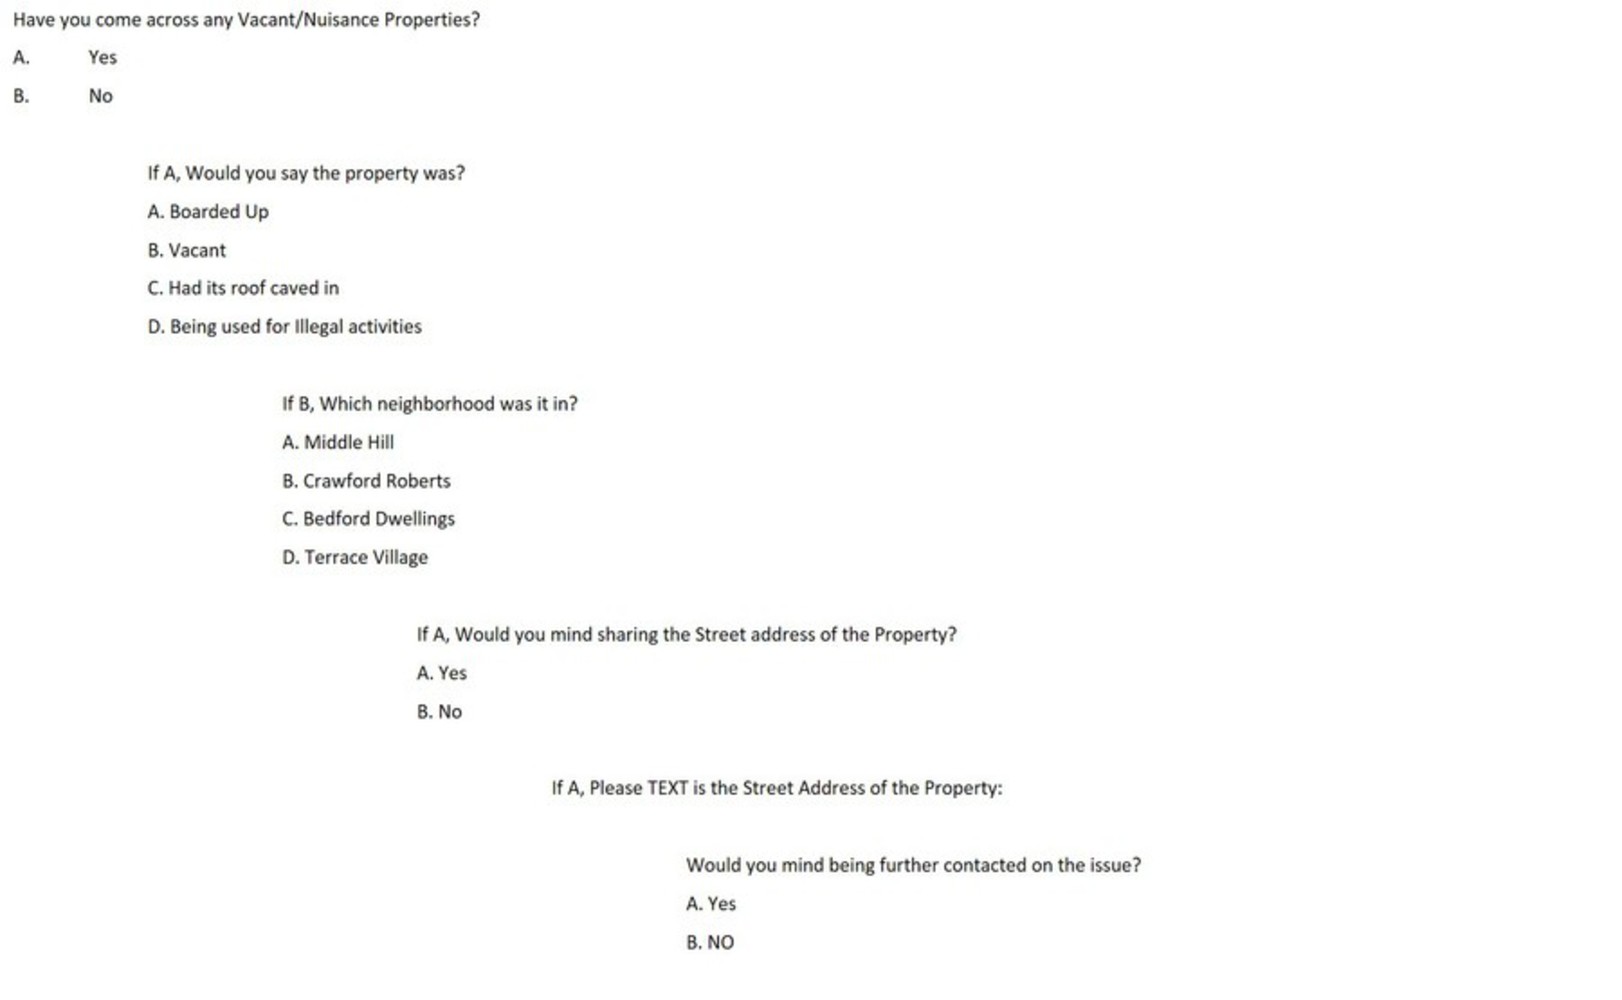
2. A front-end interaction system needs to be designed (discussed later on in the project) to get text based answers from people. The questions would be predefined with simple yes/no or A/B/C/D options.
3. A backend database would need to be prepared based on what data is collected. This backend data would then be used as a data set to make visualizations and highlight trends. This system could then be used as already discussed above in the ‘Data Visualization’ section. This, however, might be a slight expensive system with costs up to 9$ per respondent. This would need grants from the city/county which would involve some sort of political tug of war. However, once implemented, this would have the largest impact as the capacity can be expanded anytime and also the data can be collected from anywhere and anyone.
Mediator Approach
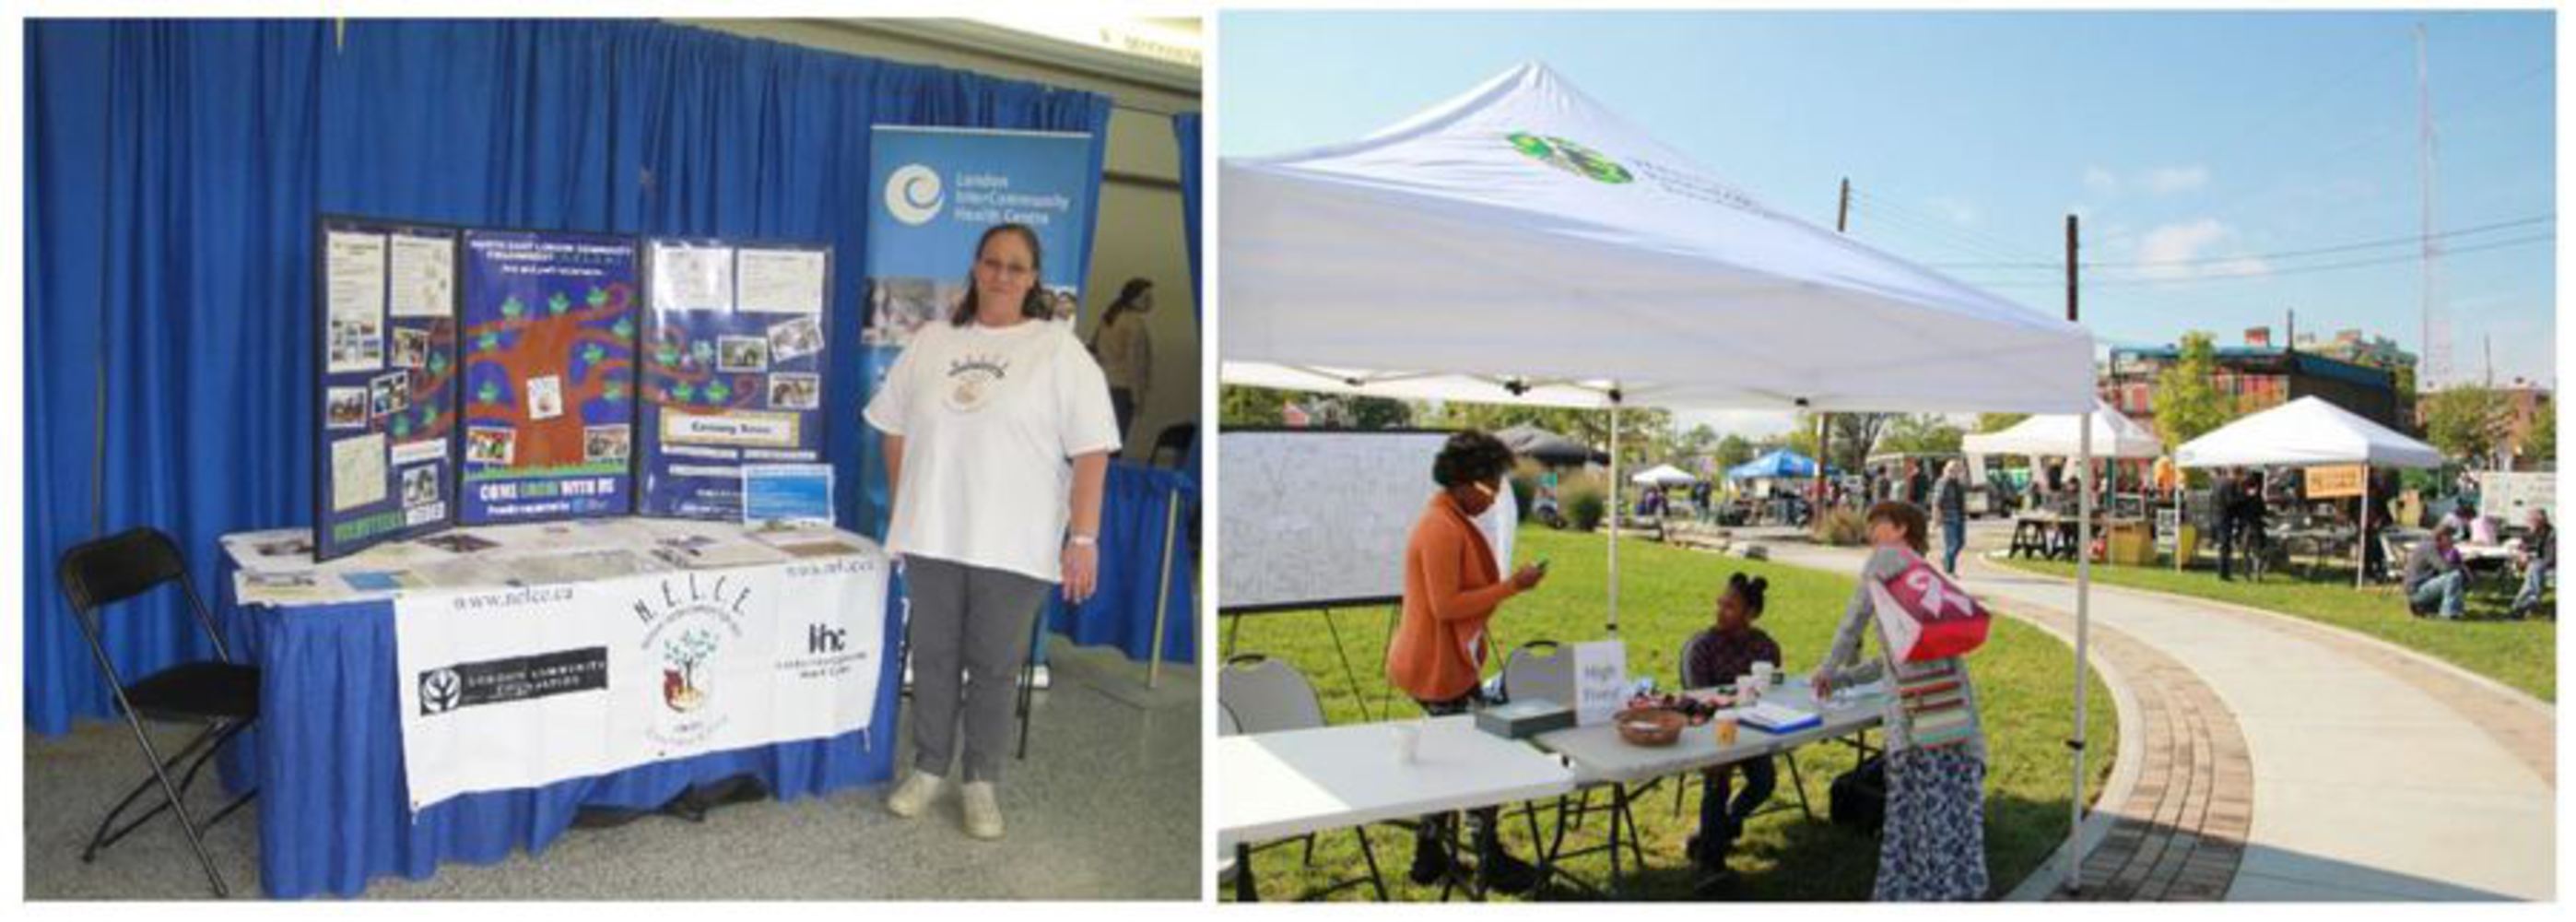
1. Setting up a booth or a small even in the community with mediators/counsellors who the residents could talk to and express their concerns. This is the rawest form of data collection, but this would also garner the most trust as people like speaking to human beings and not robots. The impact however, of such a system is limited to the number of such events and the specific locations and timings. There is possibly no common time to get all the residents in together and there might be a chance of missing out some key issues.
2. The biggest advantage of such a system would be to get a firsthand/detailed (not just yes and no) account of issues.
3. Cost wise however, this would over long durations, turn expensive. Say if this is a yearlong commitment, the average salary of a counselor in Pittsburgh is around $35,000. This coupled with cost of system would total around $50,000 per year. This is just cost of data collection. The cost per person could be $9-$47 (http://metroquest.com/much-cost-engage-citizen/)
Technological Intervention
1. Projection Mapping – In case the engagement does take place within the community, projection mapping can be used as a tool to make people understand the space a bit better. They would already know the place and could pin-point the exact locations that need interventions. Mapping the nuisance properties on an actual map of the neighborhood will be helpful. However, the cost of this set-up is high and the potential impact is limited to people attending the event.
2. Chatbot - Getting people onboard for either the ‘text’ based program or the mediator program could be done using a chatbot with a predefined set of questions and answers. Although at some point, this will have to be handled by a real person as the AI technology is yet to be at a stage where it can effectively mimic a real person. It is easier to build, the costs associated are those of getting a server to host the bot and database. Impact could be great, almost as large as a text based application.
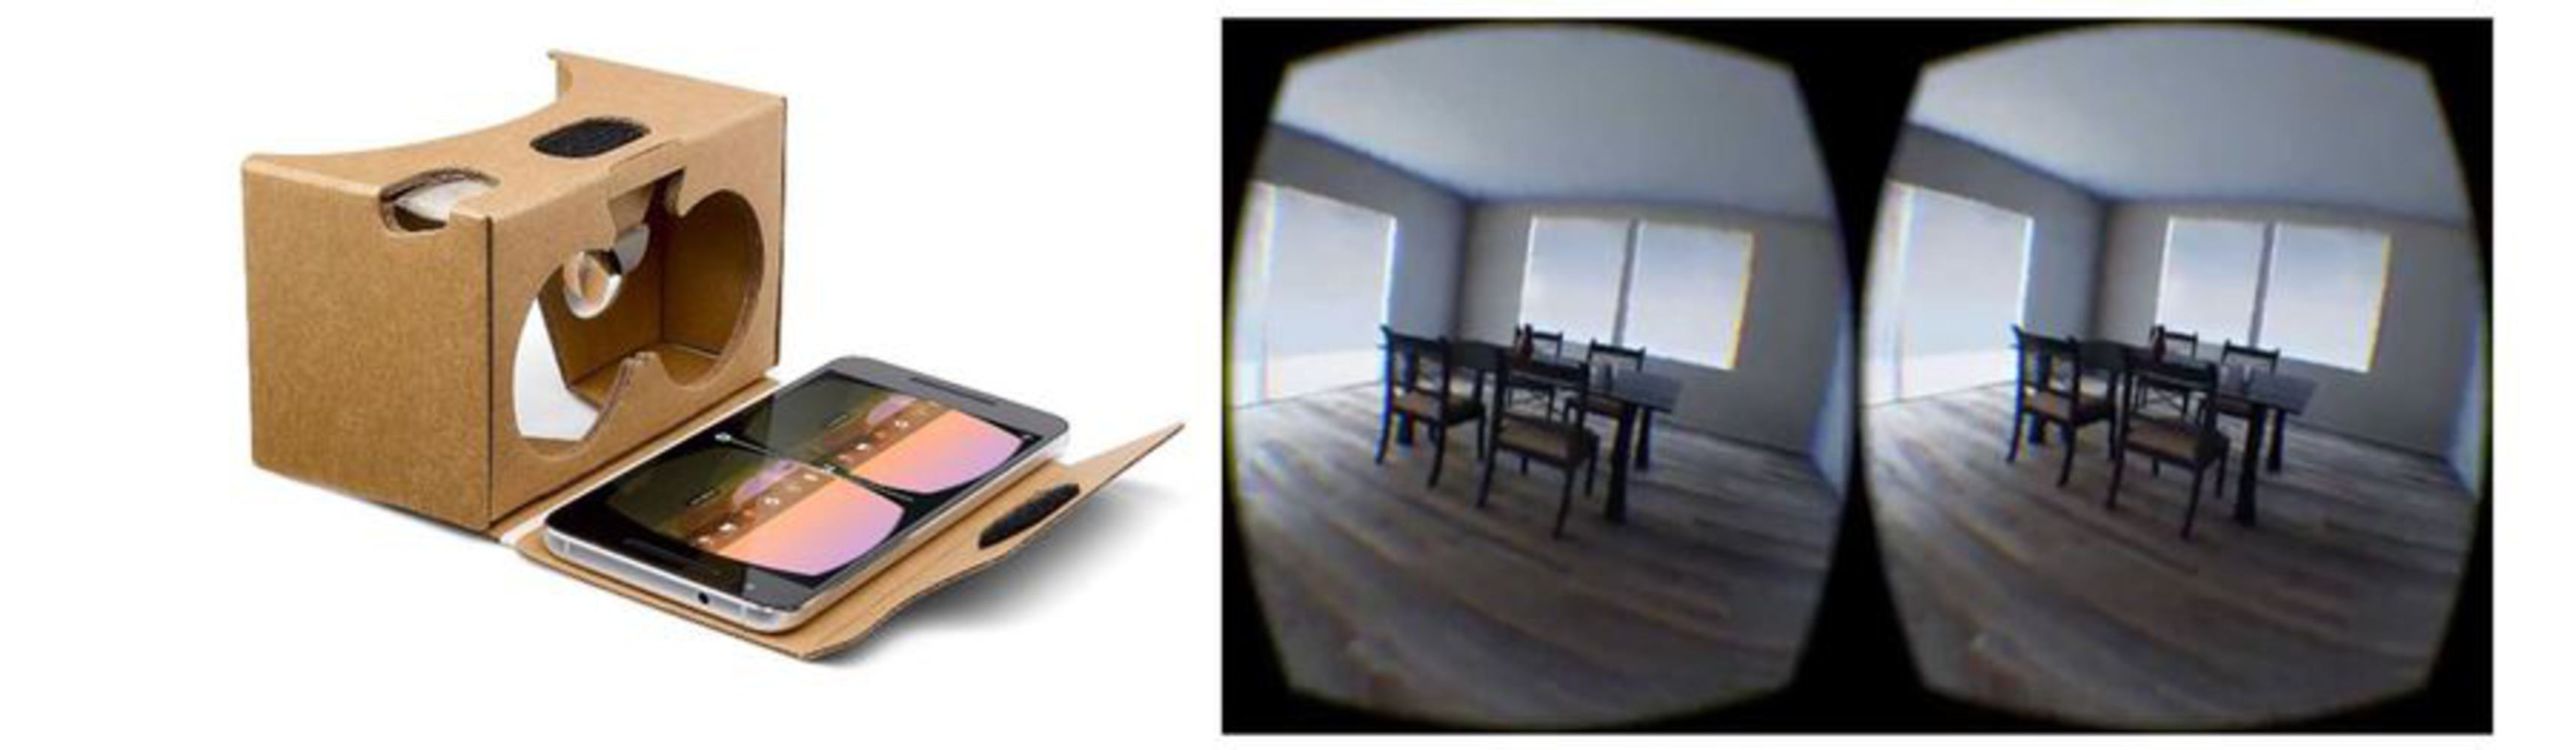
3. Google cardboard – Simplistic VR headsets could be used to create awareness regarding ‘what constitutes a vacant/nuisance property’. A lot of people would not know for sure whether toc all in a property or not as they are not sure if it is actually vacant. VR headset can be used to show them what qualifies a property to be categorized as vacant/nuisance. Cost of developing the app would be higher, $10,000 to $60,000 depending on detailing. However, the setup is not that expensive. The impact can be big with increasing use of smartphone and fast internet connections. Currently, the impact was gauged to be moderate as most people will not have the setup of a smartphone equipped to run the high end app.
Engaging Place – Outreach Plan
The strategy recommended to be the primary one would be a text based data collection system which would be integrated between the city and the county. When considering just Hill District, we could be looking at 500 respondents per year and for the whole city it would be 5000 respondents.
The stakeholders:
1. Allegheny County – to have access to service request inspections interface of Housing and Community Development department. Also, a source of funding for interface
2. City of Pittsburgh – To have access to 311 interfaces and also a source of funding for interface
3. Hill District Consensus group – To create awareness and know the locations of the outreach posters.
4. Pittsburgh Community Reinvestment Group – Funding source for outreach
5. WPRDC – To talk to the stakeholders about sharing and making the data open source
Cost Considerations:
1. A ‘textizen’ based system costs around $3-$9 per respondent on an average. Considering a capacity of 500 respondents in the Hill District, the costs could be up to $4500 for the setup.
2. As this is eventually a city-wide issue, a program like this could cost around $45,000 for the initial setup. This does not include the operational costs or salaries city, or county are paying to people associated with this.
Deployment:
1. Areas where the posters/pamphlets would be put up will be decided in conjunction with the Hill District Consensus group which has residents on its board.
2. Some of the possible sites for an outreach program in the Hill district could be:
a. Hill District First resource center
b. Hill house association building
c. Thelma Lovette YMCA
d. Hill District Consensus Group office
Possible Interface
Data Usage and Visualization
The database created from the above setup could then inform a dataset which sorts all the data at the backend. This would be similar to that of Burgh’s Eye View. The users can view the data and also export a CSV by selecting different filter parameters of the data. This would help in making the data meaningful and more usable by the general masses.