About
Find a cultural phenomenon/activity of your everyday life that you believe can be improved by some form of representational and or interpretative information display. Choose something that is personally relevant and meaningful to you.
See for more: https://docs.google.com/document/d/1eYZdAZgewPCqES7zwQeQwW5dxzyL7jCXOL0AikBuLQM/edit?usp=sharing
Share this Pool


Discussion 124
-
Technology Time-Out
 Almeda Beynon
This is a great idea! There are so many of my hours that I would like to get back from the depths of technology. Good connections to the examples and readings as well. And, your feedback on other people's project has offered many of your classmates some interesting things to think about in their own work.
Some things to consider:
-- WHY are we (as humans/students) so quick to lose ourselves in technology, even though these computers are the very thing tying us to our work, classes, and other obligatory things? How can this information inform how you present the information to become initially engaging to the audience?
-- It is also interesting how this "time map" is only available on the computer. It is the very thing you want to avoid, but it is also the only place (perhaps) where you would see it and it could make a difference. -
Wi-fi Waves
Almeda BeynonGreat job presenting the information! Considering the amount and type of feedback that you received, it seems like you have found something that is necessary at CMU. Your careful response to the feedback is also going to be good practice as you move forward.
Some things to consider:
-- look a little further into what it means to need a "map of wifi." This could inform how you present the information, and may be a little more initially engaging to the audience. -
A Cup of Coffee: Bridging the Gap
Almeda BeynonThis is a great idea, and the manifestation of the different "coffee cultures" is very interesting. This would be very engaging for viewers, and people would be able to connect to other cultures through a shared experience. The connections to the reading and examples are also well defined.
Consider some visual aids in your presentation. The research images are nice, but maybe a few more from each culture could be a way to present the "feel" of this installation to a potential curator.
-
Skin of CMU
Almeda BeynonGreat job of linking to the examples! I think the presentation of your project accurately represents your goal. Consider the "map" under the colors, is there a different way to represent that information that is more cohesive to the colors/lines? Could it somehow link to how we (as humans/students) view "getting dressed" everyday?
The careful consideration of your peers' feedback is also great, and it could be helpful in later iterations of this project.
-
Bathroom Data
Almeda BeynonI agree with your comment feedback, there is not much of a visual component to this project. And, going a little deeper, consider connecting the project to the people that will be using it. Your project is technically similar to the Wind Map, but why does the Wind Map display this information, and why is the Wind Map's representation of weather different from the Weather Channel? What is the ultimate goal.
This said, the project has gotten much more defined since lab. Great job of clarifying your ideas!
-
Occupancy of CMU Sports Facilities
Almeda BeynonInteresting way to represent the data. It has come a long way from the idea you had in lab. Also, thanks for reviewing the feedback and commenting back. This is how ideas get refined. And, thanks for commenting on other projects, this is helping your peers refine their ideas as well.
How does your project connect to the readings and examples? Explore them a little further, and they can inform choices on connecting with the audience, and how your presentation can engage them faster, resulting in a more effective presentation.
-
Music Characteristics Web
Almeda BeynonGood job of clarifying ideas based on the feedback from class. I have often heard that an "instrument is like an extension of yourself." Perhaps this could inform some alterations to your piece to make more of an emotional connection between the project and the audience. Also, how does your project connect to the readings and examples?
-
Fast Food Trends
Almeda BeynonInteresting connections to the readings and examples. Also, good job on presenting your project in the Gallery format.
Some things to consider:
-- Try exploring some of the other ways that the audience reacts to the examples, instead of just focusing on the visual way the information in presented. Look further at the emotional connection in the visual representation of these pieces. In the Napoleon Map, the thickness of the line directly correlates with the loss of life in war. Connecting to the audience visually and emotionally tends to draw people in faster, therefore have a bigger impact on the audience. -
Television Trends
 Kristen Smith
I like this concept quite a lot, as (before coming to CMU) I used to watch TV quite a bit. I'm a big fan of the fact that you show people what the top TV show is for each age group. However, people who fall into the age range of viewers who generally watch Breaking Bad but don't watch the show themselves won't be able to tell how much they are watching TV based on your graph. It is understandable-- there are quite a lot of TV shows that exist-- but maybe showing the top few TV shows for each age group would be slightly more inclusive and affect more people.
-
Music Characteristics Web
Kristen SmithI like this concept. It's certainly hard to learn musicality-- 15 years of piano and I still don't have it down completely-- but it's nice that you're trying to analyze how it works in an attempt to teach others how to gain it. What if a person is using your application for the first time and is listening to a genre of music that is entirely new to them. If they are looking at a song and see that "wobble bass" comes up, but they have no idea what that is, is there a way for them to figure out what that means? Perhaps a definition could appear if you hover over the word? Otherwise, the concept is very creative and could definitely prove useful.
-
Daily Motion
 Laura Lodewyk
I had not considered the possibility of reminder pings throughout the day, Ivan, but I think that is a great idea and could really help improve the functionality. However, as Tonya pointed out, what one person wants to be 'correct' isn't the same as someone else's. So I would have to think about how to incorporate different uses. Do you guys think it would be a good idea to be able to record some sort of goal posture? For example, if You wanted to stand up straighter, you would stand the way you wanted and hit some sort of button (Record or Goal). Then that posture could be saved and when you deviated too far from it, you would get an alert. Would that be a problem? Would you potentially want different goals for different things? Such as one goal for cycling, another for general posture, another for running?
-
You've Got Mail
 Amanda Marano
Kristen, that's a really good idea! I really only had five days on this example graph to show a baseline, and the actual graph would probably have more days on it, but I like the idea of also having a line graph for more long-term data, and then maybe being able to see more short-term data by zooming in.
-
Gaming Habits
 Christina Reimond
It is a really interesting idea to observe gaming habits of large amounts of people, but I agree with Naomi, and wonder if perhaps it could be presented in a way that is easier to understand. Could you clarify for me what exactly the bars represent? However, this idea for a data visualization could be incredibly interesting to not only a gamer, but also gaming companies!
-
Senses of Happiness
Christina ReimondInteresting idea-- this would result in a very thought-provoking visualization! However, when people consider what makes them happy, there often are aspects of it that are not really related to the senses, like spending time with family. Also, there are feelings that influence happiness, like feeling the warm sun on a day in early spring. Though I understand that you may be leaving out the types of happiness that don't seem directly related to the senses (the first type I mentioned), I wonder how you would include happiness related to feeling? All in all, I really like your idea and implementation!
-
Skin of CMU
Christina ReimondI think this is a very interesting idea, and it would be cool to see how many people are wearing a certain color at any given time! I do wonder, though, how type of clothing would be recorded in this visualization? I understand how color of clothing would be represented, but how would you make representations of people wearing, say, heavy coats or winter clothing look different than someone wearing shorts and a t-shirt?
-
Skin of CMU
 Brian Lai
@ Francisco - Yeah I realized that participation would probably be lacking since there is not really much that people gain from using the app, and they probably wouldn't care enough to keep updating the clothes that they are wearing. I also though about using camera coverage at a point high above the campus, but at best this would only be able to report color and not clothing type
@ Amanda - I guess I hadn't really thought too hard about it, but in my mind I planned it to be a real-time updating map because I wanted to have time as a factor for the movement, and if there was a time when there was little to no movement then I think that would still be okay.
@ Kim - I can see how this could be a concern. I think a reasonable solution would be either to blend colors when the density gets too high to show a general color of the area, or to just shrink the aount of space each dot (person) gets on the map.
-
Wi-fi Waves
 Anna Tan
This is a very useful visualization that I would love be see implemented one day! One thing I would also like to see in the visualization is the range of the wi-fi signal. For example, sometimes when I'm just outside the door of Wean, I cannot get any wi-fi signal. It would be nice to know where the dead spaces for wi-fi are and the regions I need to be at to get wi-fi.
-
Where To Intern?
Anna TanThank you for your comments! To improve my project, I think adding a legend would be a good idea, especially for the color gradient. I understand that when looking at the visualization it can be unclear what kind of range the color gradient represents. By adding a legend or even having one of the circles be an example circle with descriptive text beside it, viewers can more easily understand what is going on in the entire visualization. Also, my visualization can include maybe most common strengths and weaknesses for a specific company by showing them when the viewer mouses over a circle; that way, I can add more complexity in the data displayed without overwhelming the viewer.
-
Gaming Habits
 Naomi Sternstein
This is a very interesting concept- especially because I don't know that much about video games, so it would be interesting to see the data on this. The only thing that could have made the data a little bit more interesting or accessible would be to represent it in a different way. It was useful to have different colors for different types of games, but maybe something other than a bar graph would be more attention grabbing and easier to follow.
-
Daily Motion
Naomi SternsteinI really like this project- I think there is a definite practical use for it, especially in correcting bad posture, but also a very aesthetic and artistic use for it. The collected data points could also just show how human bodies naturally move, since movement is so fluid and could create a very unique and beautiful representation. Data represented like this is so versatile that I feel like it could be hanging in a doctor's office or in an art or history museum.
-
A Cup of Coffee: Bridging the Gap
 Jacob Weiss
I would go to this exhibit. However, I think people should be given coffee to drink to get the full experience!
-
Comedy Set Optimization
 Daragh Byrne
It's an interesting problem space, but I would second Kevin's question about do they not implicitly receive this information from the audience/response? Maybe this is something you could think about integrating. For example, if it wasn't an audio recording but a video playback of the audience reaction would that give them a richer perspective?
Beyond that comedy is much more complex than just the laughs. Depending on the comedian and style, shock, silence, gasps, etc might be the desired reaction at a given time. What if you only showed the stuff that went wrong? That wasn't as expected? What I'm really asking you to consider is how could you be unconventional in your approach but still arrive at a rich outcome?
As a footnote, Viegas's perspective on a 'forceful point of view' isn't about irrefuatable data - its about creating aesthetic forms that encourage people to reconsider their everyday experiences, cultures etc. They are perfectly fine with manipulating data to arrive at an outcome that provokes inquiry.
-
Television Trends
Almeda BeynonGreat job of incorporating group feedback into your final project. This looks much more detailed than the initial idea you had in the lab.
Consider looking at the examples and drawing deeper connections between them and your piece. How can your piece engage the audience in the same way as the exemplar? Maybe incorporate an element that initially "grabs" the audiences attention, and encourages them to explore the piece further.
-
Emotion Graph
Daragh ByrneMauricio, great work. You've not only come up with a great visual approach to representing and revealing emotion, but also have documented and communicated your idea extremely well.
I really like that you've left plenty of room for individual reading of the outcome; there's no absolute applied to the representation of emotion, instead it's heuristic and open-ended, allowing people to inquiry and apply their own meaning to the shape, color and form of the emotion presented.
-
Gaming Habits
Daragh ByrneI think you have misunderstood Viegas's point on a “forceful point of view.” A forceful point isn't about the raw form of data, its about how that data is presented to the audience. In fact, they favor manipulation and interpretation and leverage the art as a method to creative evocative or provocative representations that challenge expectation and encourage someone to reconsider expectations of conventional, communal or cultural 'wisdom'. They definitely don't say the 'data itself is indisputable', instead they open up avenues for individual interpretation.
-
Money Map
Daragh ByrneAs a follow on point, the representation of your idea needs some attention - the abstract is used for the body of the text. It's not easy to read - move some of this content inline so that a viewer can more easily digest the concept. Some illustrative graphics before you hit your sketch might also be useful too.
-
Money Map
Daragh ByrneThis is certainly a pragmatic solution to a real world problem, but how might you use a representation of money / budgets to give someone a revalatory rather than a reflective experience of their wallet/bank balance? The approach demonstrates a perspective on graphic / data excellent - but how might you move this into an aesthetic realm and encourage people to reconsider or confront their relationship with money and spending?
For example, people often perform mental accounting - an great example is Dustin Hoffman http://blogs.reuters.com/great-debate-uk/2014/04/15/mental-accounting-the-jar-fallacy/ - how might you challenge the way in which people typically organize themselves around their money on a monthly basis rather than conform with conventional modes of planning?
-
Entertain Me!
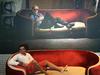
Daragh ByrneWell done! This is a really nice approach to creating an embodied representation of a cultural form - cinema. Making the scale of a movie's budget proportional would give the visitors a very different sense of what it might take to produce a modern blockbuster.
As an alliterative to the timeline approach - showing the increasing cost over time - might you alternatively choose a single year and select different genres of successful movie - action, drama, comedy, scifi and perhaps an indie movie. That could show the disparity in budgets equally strongly.
As another consideration, what are the other dimensions that might get someone to reconsider the production of a film? For example, an easy data point to collect might be the number of people involved in a production - by culling the list of credits.
-
Unread Books
 Brian Li
I really love this idea. The whispering books give off a Harry Potter restricted section vibe, which really matches your purpose well. I was wondering if you considered adding a data stream based on genre of the book. Maybe you could have different styles of fonts to represent the different genres.
-
Unread Books
Daragh ByrneThe approach is interesting and I think it would definitely create a provocative experience for people visiting a library. The question of using sound could be controversial - how might it effect the experience of people just being in the library? For example, Could you make this something which isn't overt but experienced through exploration where by exploration of the library can direct you to interesting reads that are overlooked...
As another point, this is very text heavy. It would be great if you could think about how to represent your work for someone to quickly get a sense of the key ideas. Drawing out some snippets as quotes, adding a few illustrative images in the library, or making some of the text bold to make it quickly scannable, etc would dramatically improve the richness of the presentation
-
Money Map
 Teddy Lee
If you look at the example, it is a bit faint, I intended it to show only the expenses from the last week and you could switch between and progress through weeks and it would only show the transactions from the last week.
-
Breaking Down Dishes
Brian Li@Kim Lister
I only used a gradient here to try and show a sense of depth. In the real product, the rings should look more solid and 3-dimensional (I kinda rushed these). I admit I didn't think about looking for a particular element when creating this visualization, so some sort intuitive ordering or search option would definitely be a nice addition. However, I don't think a web would serve my purpose. My goal was to compare and contrast the different patterns created by matching ingredients. I think a web would look a bit too chaotic. -
Breaking Down Dishes
Brian Li@kevinramser Yes, that is how I intended to collect and interpret the data.
-
Daily Motion
 Tonya Sedgwick
I think that if I was to use this program, the one thing I would most want would be little reminders. Perhaps at random intervals, once or twice a day, it could give me the visualization of my current posture, and either chastise or reward me with some kind of imagery (like getting points in a game or something). I think interaction with the data would be useful. Also, would you be able to customize it for different athletes? I am a cyclist, so my proper posture would be very different, from, say, a martial artist. I really like this idea, because I have terrible posture.
-
Bathroom Data
Tonya SedgwickI think this is an interesting idea, but I agree with Eric that there is not much focus on the visualization. I'm a decision science major, and we talk about "nudges" which are ways that you try to get people to make good decisions. In this case, a good decision you want to get people to make is to stay hydrated. I'm sure there are ways you could come up with imagery that creates incentives for people to drink enough. Perhaps something with color or sound. I think I'd be quite amused if, for example, every time I went into a public restroom I was applauded or treated to the infamous Fay Wray scream, depending on whether I was hydrated or not. This would add a bit of competition (because the people in the stall or urinal next to you would hear whether you got the good sound or the bad sound), which would add an extra layer of incentive. The visuals that accompany the sound would support and add extra information to it.
-
Health Communication Map
Tonya SedgwickRegarding mood--I'm not 100% sure the best way to go about this, but I can think of two options which, were I to actually sit down and make the app, I would experiment with. One is to provide a scale (say from 1-5) which offers a spectrum of upset to happy, with the center number being neutral. Another would be to have a set of ~5 questions (which obviously would have to be carefully chosen) that would gauge the person's mood for them, and produce the rating.
The symptoms graph would be separate, although the interface for inputting date would probably include everything all in one go. I would want the app to be able to "learn" the person's individual symptoms, so they'd be able to put the ones in that they felt were most important. I would hope for the app to have the ability to specialize according to different conditions (because pregnancy is very different from, say, lupus), which the user would input on the day they downloaded the app or created a count on the online interface.
-
Work Life Balance
Tonya SedgwickThis is adding on to what Laura said: what if you could make it check in with the GPS in their phone to verify that they're in the right building? That way, if they aren't, then it does something scary to the interface (like everything goes red or something) in order to give them a nudge towards not skipping classes.
-
Breaking Down Dishes
 Kim Lister
Why did you choose gradient rings in particular? I feel like I would have a hard time locating a particular element on a ring unless they were arranged in a way that followed some very obvious ordering, such as alphabetically, but in your system it seems to make more sense to group similar ingredients together so that spinach could be easily switched to arugula, for example. Would something more like a web better serve your purpose?
-
Skin of CMU
Kim ListerI think you might have another problem with implementation: if you try to show every person's color on the map, you'd have too many small points of different colors to be able to see overall trends. You might want to think of a way to find patterns in the data and exaggerate them in the display, or somehow tweak how things are displayed to make the patterns more visible.
I could be wrong, though. Maybe this would be fine. It's hard to say without implementing it.
-
Life Cycle of a Dance Class
 Eric Wang
I think with the variables you picked, you can definitely create an amazing visualization from it. Using different colors/shapes to represent each creates large potential for an interesting piece. The data you picked is practical to accumulate too. Though I question skin temperature as I think there could be too many alternate factors influencing it. But who knows, that much just make it more interesting.
-
Comedy Set Optimization
Kevin RamserThis is an interesting idea. I don't go to many comedy shows, so maybe you can speak to this better than I, but my feeling is that a comedian can glean more from an audience than an app that simply detects sound levels. After all, people can boo and heckle at least as loud as they can laugh. How might you compensate for the app's inability to discern between the nature of these different audience reactions?
-
Gaming Habits
Kevin RamserPeople self-reporting their own habits seems like not the most reliable method for data collection. People could forget how long they played which game on any given day, they could intentionally underestimate how long they spent playing, they could forget to log hours altogether. What other, perhaps more objective methods could you use to collect this information?
-
Fast Food Trends
Christina ReimondThat's a great idea; I think that would make the chart much easier to read so that the viewer could compare different categories of data more accurately!
-
CMU Diversity in Departments
Kevin RamserI'm impressed that you took the step to actually collect and represent this data, which was not required. Your visualization of the data is very beautiful. Can you explain why you used gradients instead of solid lines to demarcate the different groups of students? I'm not sure what the different shades of purple and yellow are indicating.
-
Breaking Down Dishes
Kevin RamserI'm having a bit of a hard time understanding your description of how this works and where the data is coming from. Are you compiling data from cooking websites and suggesting combinations of ingredients based on the frequency with which they appear together in recipes online? I understand and like the rationale behind your choice for this project, I'm just unclear about how the system collects and interprets data.
-
Life Cycle of a Dance Class
 Talia Lesjack-Randall
To clarify for everyone, the y axis is currently nothing other than an artistic choice. The heartbeat isn't shown here, since it would be represented by the pulsing of the dots if this were a real version. Sorry that wasn't clear! I'll have to think more about the idea of being able to trace individuals. I didn't think about it originally because I was more focused on the group as a whole, but maybe there is a way to incorporate that. Thanks everyone!
-
Unread Books
Kevin RamserThis is a unique approach to an interesting and accessible set of quantitative data. I like the interpretative approach to the data as a sound installation, especially in the library context. Very thoughtful. I also like the idea to personify the books with whispering voices that call out for their owners to be read. I wonder what you would use to generate the soundtrack. Are the voices whispering call numbers? Dates? Lines of text taken from the books? The content of the soundtrack itself is a central element that feels unexplored in your explanation.
-
Occupancy of CMU Sports Facilities
 Rikky Roy Koganti
@Anna
That would be a pretty good feature, it could be done by featuring 6 icons on screen together, similar to the starting screen for the app.@Amanda
Yea, i wondered about that concern as well. For the UC gym, the cardio machines are used a lot more than the free weights and the other machines. Well, i could split the gym up into two icons, one for the cardio machines and one for the other muscle training stuff. There are other people counters that can be placed on the ceiling above the cardio machines as well. This counter just checks for people in a certain radius, so it is possible to edit that radius to just the cardio machines.Thanks for the feedback!
-
Wi-fi Waves
Christina ReimondI think this is a great idea; it is useful, and makes it easy to compare data (that is, different hotspots). I really like the idea of the 3D view for buildings with several floors-- otherwise it could be incredibly difficult to figure out where the signal would be strongest in a building of, say, 30 floors where the Wi-fi originates from the 12th floor. I also think it could be interesting to implement a feature to observe the bandwidth usage over time!
-
Life Cycle of a Dance Class
Christina ReimondI think this data visualization is beautiful, and truly does tell a story. I used to take dance classes, so I understand how much energy can change throughout the course of the class, and I think that recording heart rate and skin temperature data does a great job of capturing that. I also think it would great if a dance instructor could see this visualization to get an idea of how those in the class are feeling. Just from a quick glance, an instructor could see that maybe the students have been working very hard and are ready for a cool down, or perhaps the opposite. I am curious, though, if the y-axis represents any sort of data as your data visualization is designed currently? In your example image, the dots seem to move down a little in the middle, and I wonder if there is an explanation behind that. All in all, I think this is a great data visualization; it is beautiful, useful, and makes it easy to understand the data!
-
CMU Diversity in Departments
Amanda MaranoI really like the way you chose to visualize the data. The circles are both very attractive and easy to gather data from. I also wanted to ask about depth of data gathered. I see you have numbers and percentages from international students and permanent residents in general, but have you considered making sub-charts that identify the original countries of origins of these people for these schools? I think that chart would have quite a few more colors, but with easy to see charts like this, I think that the visualization would probably still be easy to gather data from.
-
WorkMap
Amanda MaranoI agree with Kevin, and I also wanted to expand that question into the specific section you spoke about movement. I think you were going for the idea that if you're walking around or working out, then you're not "working", but if someone is on a sports team or is in a gym class for credit here, would that be considered work because it is a commitment or they are getting a grade? Also, does this app count time in class as work, even if you are in a lecture like 112 and computers and phones are not allowed. How does the app or software track dead periods?
-
Music Map
Amanda MaranoI really like this idea, because I use a lot of programs like pandora and spotify discover that help me find new music. However, one of the times I find most frustrating is when I hear a song I like at a concert or on a commercial and I can't find the name of the song to listen to later. While I really like the initial idea of playing a track without displaying the name, I think after its over, there should be an option of asking for the name or artist of the track, so that person can go listen to that song or other songs by that artist later.
-
Breaking Down Dishes
Amanda MaranoI really like this idea, trying to make food based on ingredients instead of deciding on a dish and then reading what the ingredients are. However, I was wondering if maybe you would add another ring for the names of dishes? This right now seems kind of discontinuous in the way that you can see ingredients that go well together based on recipes that only the software can see. If there were recipe names or even that ring would have links to the recipes you could click on and view, maybe it would make the entire thing more cohesive by having both ingredients and final products? I know personally, when I think about ingredients I am also thinking about the final product that I am going to eat.
-
Skin of CMU
Amanda MaranoI think this is a really interesting idea, and you brought it towards more of an artistic side instead of having the app be for any express "purpose", like we talked about in class, and I think that is really interesting and can open a lot of possibilities for even more artistic directions this can go in. However, I was wondering about the specificity of the flowing lines and colors. Is this movement going to be real-time or sped up? In between classes traffic will be heavier and during down times there will be no movement at all, so will it be an average, so no matter when you look at it you will see movement?
-
Occupancy of CMU Sports Facilities
Amanda MaranoI really like this idea, especially because it makes it easier to make decisions about where to play or work out without having to actually go there. However, I have one concern. Do the rooms in the facilities, like workout rooms, have more than one kind of exercise equipment? If the counter above the door is there to see how many people enter and leave a room, how would the software know what that person is doing? If they are entering a training room with both weights and treadmills, how would the software know or decide which icon to fill, especially if someone wants to run on a treadmill only to find they are all full.
-
Wi-fi Waves
 Ivan Wang
@Jacob: Great point, I hadn't considered the amount of networks around. Perhaps one way to resolve this is to take the average/aggregate of multiple networks in the same area; then, when a user zooms in, the waves can split into the several different specific networks. I could even include a number near the lock icon indicating the number of networks in that location.
@Kristen: Good idea! I mentioned including a popover displaying details for a specific network (e.g. network name, security type, etc.), but it may also be useful to show the number of nearby networks. For the problem of several networks in a building (e.g. on different floors), zooming in far enough could switch to a 3D view (like Google Street View) that shows the elevated locations as well as geographical.
-
Strange Interactions
 Dan Cheng
It is a great idea! One question I have is that for people from different backgrounds, they may greet strangers in different ways due to their cultures. It looks like the combination of greeting strangers pictures will be synthesized into one fuzzy one, but are you going to eliminate the outliers(like people who have strange reaction to stranger)? Otherwise, the final fuzzy picture may turn out to be a very strange one(since you also include the body language in the graph).
-
Bathroom Data
Eric WangI think this is a great idea in terms of technology and a good pitch for a project. However, I feel there is a not that much emphasis on the visualization itself.
-
CMU Diversity in Departments
Eric WangHi, sorry for unclear descriptions. The size of the circle represent the relative "popularity" of the circle and the color proportions represent the demographics within each major.
-
You Have Been Slain
Dan ChengThis is a really cool idea which definitely help the players to improve their performance in the game. I agree with Ivan that it will be better if it provides more information! Like the information of the enemy that slains the player in the map. Sometimes the player dies not because of the geography of the place, but the enemy. If the player can get more information, he will get a better idea what he should do to improve his game performance.
-
Wi-fi Waves
Dan ChengThis map presents lots of data in one single and organized graph, which will be very clear and helpful to the users. However, my concern is similar to Jacob, since in real life lots of wifi are around, even wifi from personal cell phone. How do you choose which wifi to show on the graph? For example, when you sit beside a person who has a personal cell phone wifi that he can share(restricted access), his wifi signal should be the best one. But is this wifi going to be on the map?
-
Life Cycle of a Dance Class
Dan ChengI really like the design of your graph. It is very pretty and agreeable. But I am not sure how you are going to capture the heart beat data, seems like you are using a dynamic way to represent them. One suggestion I have is that why not make the y-axis as heart beat rate, then the beautiful skin temperature graph can be a bell-shaped one(since in the middle of the class, the heartbeat rises). Then you can include both heart beat and temperature in the same static graph.
-
Emotion Graph
Dan ChengI really like your idea, I believe recording emotion and confidence will be a good tool that helps people to reflect on themselves. For example, if a person is depressed all the time, he should be alert and make some changes in his life. Also, the graph you generate is very compelling and beautiful, it definitely embraces the graphical excellence.
However, one question I have in mind is that instead of having only one color in one time, there are very complicated patterns of colors in one time. How do you record that, is it like all the emotions in a day? And if different colors are mixed, like same level of anger(red) and joy(yellow) in a day, will the graph shows that the emotion is anticipation(orange)? -
Occupancy of CMU Sports Facilities
Anna TanI really like how your visualization is both useful and simple with representations that make your data easy to understand. One thing I would suggest for your app is that sometimes I would like to see the capacity to decide where I want to go. Instead of going three layers deep to see the capacity of each facility, I would love for there to be an option to see the current capacity of all 6 facilities at once.
-
Work Life Balance
Laura LodewykI think a lot of students could really benefit from such an app, and it might make them more conscious of how their decisions effect their stress level. Similar to Talia's point, I think it might be helpful to add more categories to your social category, similar to the Bureau of Labor Statistics pie chart. I find there is a big difference in my energy level the next day between going to a concert or watching netflix during a given evening. Looking at how you collect your data streams, will syncing with peoples calendars provide the most accurate representation of their time? For example, people with bad time management probably don't plan study time into their schedule enough to put it in their calendar, and actions such as skipping class, or sitting on Facebook while 'studying' would not be accounted for. So I think it would be helpful to find another way to gather data as well. (for example, I heard about an app that randomly asked through the day what you were doing and for how long you had been doing it...)
While this would go against data visualization ideas, since it would be telling people what to do, if you actually made something like this, it could give tips about quality vs quantity and effective study habits! That would be really useful to some people. Then they could see how their days become more balanced as the tips are incorporated into their routine. -
WorkMap
Kevin RamserI think this information could have useful applications, both for individuals looking to analyze their own work habits, and those interested in broader trends of work/play in a particular time and place. I'm just wondering how you collect reliable data on all of this. How do we define work and play? They're often not so easy to distinguish, especially if you spend most of your day on a computer. A lot of the time we're moving rapidly from page to page. Some of these may be work-related, some not. Which pages correspond to work or play may not be as easy to distinguish as you assume in your description. Say, for instance, that you're doing work by updating the Facebook page for an organization or club that you're involved with, but you decide to procrastinate by opening another tab in your browser and reading the New York Times instead. An app (or an outsider observer) that simply tracks this movement from Facebook to NYT would probably not deduce that the former was work and the latter was (a kind of) play, or at least procrastination from work. Can you think of some ways you might modify your idea to clarify some of this complexity and uncertainty?
-
Where To Intern?
Eric TeruiYour project is very well developed! You did a great job of linking the things we learned in class to your project. I also think your visuals do a great job of informing people about the general opinion of people interning at a company.
My main advice would be that an intern's opinion of a company is generally more complex than just a rating from 1-10. Much of the time, when I ask someone how their summer internship went, they will respond with "it went really well, except I didn't quite enjoy _____". Because of this, I think you should consider having the most common complaint and most common positive feedback for a company. -
Entertain Me!
Kevin RamserI think it was smart to represent an easily accessible and quantifiable set of data in an interpretive way. The choice to represent this data through the scale of physical objects is unique among the other projects in the gallery, and makes for a more arresting illustration of your subject than numbers or graphs. I like that you thought about the context of the presentation and chose a setting (abandoned movie theaters) that adds another dimension of meaning to the project. I wonder if the piece would be easier for the user to understand if the objects you use to represent the data were more uniform? Or perhaps it's more interesting if all the objects are different, but I still think you'd have to give some more thought to the logic behind the choice of objects. A cohesive and comprehensive logic in this regard will make the visual representation much stronger and easier to understand.
-
Ice Bucket Challenge
Eric TeruiI really like the changes you made to your project. Your representation of all the data is very creative. You also made the data representation much deeper with your use of space and perspective. I really like how you have the options of viewing the big picture to see the overall story while still being able to zoom in on individual neurons.
One thing I think you might consider would be the ability to search for individuals. My guess is that most people would tend to care less for random people they don't know. This would also allow you to see how the challenge arrived to certain communities such as a school and how it spread throughout that school in particular. -
Work Life Balance
Almeda BeynonThis idea is good, and I, personally, would be interested in seeing the way my "work/play/procrastination" maps out.
Consider exploring the aesthetic display of the project more from the perspective of the people using it and framing the information in a way that is meaningful to you (therefore the audience). Graphs and data are important, but perhaps you could generate some initial "picture" that connects to the audience member at first glance. This would compel them to dive deeper into the information that you are presenting, ultimately making it more effective.
Interesting relations the the readings, but take a further look at the other examples from the email Daragh sent out (Windmap, Pulse Room, etc). The examples that you referenced are all very similar, and you may benefit from researching outside of this particular way of presenting information.
Also, take a few moments to proofread before posting to the Gallery. This can help clarify your point and will make your project more cohesive and effective.
-
Emotion Graph
Talia Lesjack-RandallI really like this idea, and your graphic is very beautiful. It isn't very easy to read the emotions, however, and I think there must be some way to share the complexity of emotions in a clearer and more engaging way.
-
Daily Motion
Talia Lesjack-RandallI like this idea a lot, and it was very well thought out. I do think you could be more explicit in exactly how you would display your information, and possibly give a visual aid. You have a lot of pictures, but they seem to be related to other projects so I have a hard time imagining exactly what you are picturing.
-
Work Life Balance
Talia Lesjack-RandallI like the idea, but at the moment the data set you are using is pretty simplistic, with only three dimensions. I think this would be a much more interesting project if you could find a way to incorporate more information in your data.
-
Entertain Me!
 Amal Sahay
I still like this project! I also like the idea of hosting it in abandoned movie theaters, which seems a powerful statement of the increasing budget. I also like the two mounds idea, which evokes the idea that, yes, money was spent, but look, here's all this ROI. This is a good project with room for interesting developments (Maybe organization of the various movies could be tweaked to show more successful ones or older ones first?).
-
You Have Been Slain
Amal Sahay@Ivan Wang I absolutely agree! Both of those are relatively easy extensions to add, and I'll definitely touch on both during my presentation. At the moment, however, I wanted to focus on a specific instance of improvement before branching out to the added functionality of what you suggest. Certainly an option for future iterations, however!
-
CMU Diversity in Departments
Amal SahayThe circles are indisputably beautiful, and I think your visualization is extremely attractive. The hard part for me comes in understanding it - is this a concentration of the number of people in each school? I assume so, but then how does this circle account for the "popularity" of each major? From the description, it seems that these should do so, but I'm not sure how to read individual majors from the circles of the schools. On the other hand, if you can elaborate on that, I would declare this to be an extremely gripping visualization. Fantastic work acting on the concerns from Friday in finding this medium!
-
Technology Time-Out
Kristen SmithI doubt I would print out the data, but even if I did, I'd be happier than just staring at my computer for hours on end. That's a very interesting comment though, thank you!
-
Wi-fi Waves
Kristen SmithI think you picked up on a design that is completely necessary, and I think you designed it well. The layperson could certainly use it. I also liked how your design has fuzzy lines which represents weaker spots. You're using characteristics that people normally associate with one another which is really cool and seems to be effective. Could there potentially be some sort of pop-up box if you hover over a hostpot? That way, you may be able to convey more information to the user, including whether several hotspots are sitting on top of each other in a large building or not.
-
You've Got Mail
Kristen SmithI like the fact that you've somehow accounted for every possibility of having false data. The way you set up the computer program ensure that you won't have a problem logging your own data in to the app. My main question is what happens after a week has passed? Will the data shift down a day? In that case it would be hard to see your entire history.Will the data disappear and make room for a new week? In that case, you'd have the same problem. I think the most effective way for you to show your data is by having a normal graph with connected plotted points. One line could be orange and one could be blue so you could easily see the distinction. Plus, this way, you could see a lot more of your data than just five days' worth.
-
Daily Motion
Dan ChengThis is a very creative idea. These data will be very helpful for not only users but also therapists. Having bad posture myself, I think it will be excellent if I can record my movements and reflect on them at the end of the day. One suggestion is that instead of making the points overlay each other, maybe you can make the graph dynamic, that is, a moving graph by putting each graph in a frame, so it can generate the actual movement of the user. something like the wind map we saw in the video. It might be more helpful and clear to the viewer. Also, I agree with Ivan that it will be great if it will beep when we have a posture problem while recording.
-
Where To Intern?
 Mauricio Cano
Because this is an important subject for many of us, I think that this visualization is a great way of enhancing people's experience when looking for an internship. I wonder if knowing which companies are well-liked will increase how difficult it is to get a summer position there (given that everyone will be applying to the better ranked companies)
I really like the idea of having a companies clustered together by industry, this way people could find companies within their interests that they didn't know existed! -
Life Cycle of a Dance Class
Mauricio CanoThis has the potential of creating a very beautiful piece. It would be awesome to have it be an interactive map where each student could see which dot on the piece was theirs. That way, just like the heart-beat light bulbs in the examples, each user could connect more intimately with the piece, given that they can see their contribution to its creation. Additionally, it might be of value to somehow mark the transition from one dot to another (for the same person) through some sort of flow-y graphic. (to make it easier for people to follow their own dot transitions over the entire piece)
Overall, this was excellent!
-
Daily Motion
Mauricio CanoI think it /would/ be interesting to see your project as a time series over a long recording period for a subject whose goal is to radically improve posture through some sort of therapy. It would be a clear illustration of the progress over time. The fact that the points are semi transparent and connected by "joint lines" is a good approach to representing the data since it allows for an intuitive understanding of the frequency with which individual data points land on a given area of space.
-
Gaming Habits
Jacob WeissAwesome concept. The only issue I have is that while you mention large data sets, it seems like the implementation is only for people to look at their own habits. Since we're talking about data visualization here, it would be really cool to have a visualization of everyone's gaming habits in one place. There are many different ways to display this, and this could be what developers look at when they develop new games (as you mentioned above).
-
Skin of CMU
 Francisco Rojo
I think this visualization would be very informative as well as meaningful. It would be really cool to see what factors affect the color of clothes.
The only barrier I see is the implementation. I do not think it's plausible that a significant amount of people would download that app and keep it updated daily. And I also don't know how else to get that information. Maybe computer vision/machine learning with security cameras around campus? Is that creepy/ do we have enough cameras for that?
-
Bathroom Data
Jacob WeissThis is awesome. My favorite part about it is that there's no downside to its implementation - if someone doesn't care about this data they don't have to look at it. This is very well thought out and I don't have any criticisms!
-
Money Map
Francisco RojoI think this kind of graph would be very useful to visualize expenses and track your personal flow of money. I wonder if, over time, this graph could also get too cluttered with information to be useful. Maybe it would help if you could set it to only show like the last year, or the last month of cash flows.
-
Music Characteristics Web
Jacob WeissI like how you shifted your original idea into something just as cool but more relevant to the assignment. My one issue is that while searching the internet for relevant keywords would definitely make a cool graph, it would not be able to add new data when "certain elements are added" in real time. If there was a way to correlate the data to a time stamp, the issue would be solved, but I'm not sure how one would go about doing that.
-
Ice Bucket Challenge
Ivan WangI entered this project expecting your typical network graph, but am delighted to see such a clever design. I really enjoy how you integrated neurons and the meaning behind the ice bucket challenge into the data visualization! I especially like the idea of "regenerating" neurons in real time for each new video. My only concern is that the structure of neurons may be too complicated to follow (at least in the sample picture). However, that can be solved by spreading them out more and utilizing your zoom feature.
-
Ice Bucket Challenge
Anna TanI think you have improved on your original idea a lot; your goal is more clearly defined and you made sure you include as much data as you can to emphasize your goal without overwhelming viewers. I really love how your representation has a sense of spreading and connecting to different people.
One change I would like to see in your visualization is maybe placing an emphasis on the more "influential" neurons, or people who had many long nomination chains. I think the Ice Bucket Challenge was especially successful because of celebrities participating in it, but it would be interesting to see how the celebrities' impact differ from that of a civilian.
-
You Have Been Slain
Ivan WangThis is a brilliant idea, and I wish more games had such data available. Earlier, I remember discussing how it'd be neat to see an aggregate data of not just your death and kills, but of all the players on that map. Comparing your own points to an averaged blue-to-red heatmap would be useful for self-improvement. Another idea is to allow filtering so you can see just your friends (or enemies') deaths, so you can learn to better work with (or against) them.
-
Ice Bucket Challenge
Eunice OhThis is such an interesting idea!
The way in which you took the connections between each neuron and incorporated that into the idea behind the ice bucket challenge was very clever. The whole point of this ice bucket challenge was to spread awareness and you definitely portrayed its effectiveness very well through your project.
I also really liked how you put extreme importance on the visual display and presentation of the project rather than its more technical aspects, keeping it simple enough to understand.
Great work! -
Emotion Graph
Mauricio CanoI was wondering the same thing. I feel like from the graph, people might conclude that unless their self-esteem is always high, they're doing something wrong. In any case, I think a high level of confidence/self-esteem can be achieved and maintained without unhealthy levels of arrogance.
-
Comedy Set Optimization
 asdfadfa
This seems like a well thought out way for a more performance based occupation to be able to incorporate data to improve. Maybe something to consider in the future would be to add a "Play optimal show" which puts all of the highest scoring clips together to get a sense for what that best show would be like, although the transitions between the segments might be a little awkward because the samples would likely be coming from different shows.
-
Strange Interactions
 Raisa Chowdhury
Naomi, I think those are all really great suggestions. To keep the project more controlled, I would probably just approach the strangers in similar situations. It would most likely be the street, since it's easiest to find people there. But I think those kinds of data streams could also give rise to great patterns such as the change in attitudes over time in a particular region. Thank you!
Tonya, I think it would be best in a gallery space, so comparing and contrasting the different images would be facilitated, as opposed to an online version, where it would be harder to see the project as a whole when you have to scroll or click on new images. -
Health Communication Map
Raisa ChowdhuryI think this is great idea and it's wonderful how thought out it is and how you've chosen such meaningful data streams to cover. But I wanted to know more about the data stream for mood. Since feelings such as pain, severity of treatments/medication, and overall mood can be subjective, how will they be measured? Will you give users a scale on which to rate these feelings or will it be more like an entry where they can type in their mood. If it's the former, how will you be able to use that to gauge what the patient is feeling, since each person would feel similar sensations, such as pain, in different ways? And if it's the latter, how will you quantify the information? But again, I thought this is a really good idea and the way you've made it accessible for everyone through so many different outlets is great.
-
Where To Intern?
Laura LodewykI like the idea, and I know that I would find such data to be very useful! I wonder if you could also get companies to supply some of this data? I just wonder if enough students would complete the survey to get an accurate representation.... but I don't know if there are any other ways to get the information you are looing for.
-
Bathroom Data
asdfadfaLike you mentioned, on the surface this seems like a silly idea but after a little more thought I agree that this could be very useful as it allows for regular, quick, and simple health tests that could be useful for detection of medical issues. It also seems to be well designed, if something is designed for use with a toilet it has to be quick, simple, and private, points that I think you addressed already.
-
Music Characteristics Web
asdfadfaI like the idea of an application to aid with practicing and it would definitely be useful for those times where I look at something for the first time and just think "I have no idea how this sounds." Something that would cause me concern is that just the nature of using a digital application to actually correct its users is that it could lead to a very standard or textbook interpretation of a piece of music. This might be fine for some more classical genres but for others, say jazz, an application like this might actually do more harm than good because as far as I can tell it does not allow for much interpretation.
-
Music Map
Rikky Roy KogantiI really like this new idea! It reminds me of the way trending videos around the country were shown on a map (the video on salon about Viegas). This takes this to a whole new level though, because by not showing the name of the song as well, it makes the song feel unique to that region and lets you get a better feel of the culture of that particular geographic location.
One point you might want to think about is to what extent can a person zoom in on a map. If you zoom in too much, you might get a pretty small geographic locale and the song that plays might not be representative of that area as a whole, as the demographic is much smaller. So you would want to carefully decide what limit to place on the zoom function.
-
-
Fast Food Trends
Rikky Roy KogantiI like how multivariate this form of data visualization is. It definitely alludes to the point made by Tufte in how graphical excellence is usually multivariate in form. Also, the way in which you modified the data visualization makes it easier to understand than before. Using the thickness of the line to symbolize the proportion of people eating that many times a week and the position of the center to show how many people are afflicted with that health problem makes for a clear distinction between the visuals of each variable.
However, I do have one suggestion that might make it even simpler to understand the data. What about having another line of different color, but the smallest unit of thickness, overlap with the center vectors of the current lines in the calender. This makes it even easier to visualize the center of the line. And we then have colored area around that line showing how any people eat fast food that many times each week.
-
Emotion Graph
Laura LodewykI think your project could have a very powerful impact on lots of people, since everyone has high and low points. I found that there was a simple beauty in the data visualization, and feel that even though emotions can go up and down, this shows representation shows that its not always a bad thing, and that it can be beautiful as well. I wonder if having 'averages' for point of reference would be good or bad. For example, if you have high self esteem all the time, you might not realize from this representation that this isn't normal and that others might feel you have a big ego. Would having a normal marker make people feel alienated or would it help?
-
A Cup of Coffee: Bridging the Gap
Raisa ChowdhuryI love the idea of this all, especially the fine details like how much lighting will exist in each installation. But I wanted to know how long the time spent in each installation would be. You mentioned that the Ethiopian ceremony can take up to 2 or 3 hours. Would it be the same for the installation or would it be shortened? And if so, would the others be shortened by the same percentage so that observers would be able to gauge the differences in length of each country's installation?
-
Television Trends
Anna TanI love how the information is organized in a way that is intuitive to viewers and does not feel overwhelming! Your final project has a lot more detail and a clearer goal.
My suggestion is that when I look at the chart for a specific state, my first reaction is that I am not sure if the time depicted for say 18-26 years olds is for the time they spend on Games of Thrones or for TV time overall. Also, consider how you can make the viewers make comparisons of TV time among age groups; your diagram shows clearly how the TV time varies within an age group, but I would also be interested to know how many more 18-26 years olds watch 3-5 hours of TV than the 26-35 years olds.
-
Life Cycle of a Dance Class
Laura LodewykI'm really impressed with how passionately you talk about your class and your work, and I think your project to share your classes story captures that enthusiasm well. I really enjoyed your explanation of your data visualization, and I thought the colors were quite pretty. Since you said that the colors were only there because it was a static image, and it would help show which heart rates were faster and slower, I wondered what colors you would intend to use in the actual representation. Would each person have their own designated color, so you could follow one particular story line? Or would it be more uniform to better show the story of the entire class? Overall, I find it to be a great idea to artistically shows the intrinsic data behind a interesting creative process.
-
Senses of Happiness
Amanda MaranoNarrowing down this idea really made it more accessible and less likely to be skewed when it was time to collect data, as opposed to the more general idea you started with. However, I was wondering how the data is going to be collected for the current idea. Is it going to be a survey, and if so, how will people know which sense they are more affected by when it comes to emotion? Are you going to have a series of sample images, sounds, etc, that people rate their reaction to, or is it going to be more general? I am just a little bit confused about the final data that you are going to be collecting, though it is displayed in a very embodied way, and I admire your careful consideration of color and form.
-
Technology Time-Out
Amanda MaranoI think, for your goal, noting the difference between productive and unproductive data usage is essential, because then you can focus specifically on the technology usage you wish to decrease, namely the unproductive usage. In this way I'm appreciative you took our advice in class. Other questions to focus on are, do you think that when your red unproductive blocks decrease in size, will your green productive blocks increase in size, or will your total technology usage decrease all together? Do you think your behavior will change in the way you interact with your coursework? As in, do you think you will print more assignments out, in order to read and interact with them outside of a technological context, or maybe hand-write more assignments first? Are there any unintended consequences of isolating and displaying this data?
-
Wi-fi Waves
Jacob SloneI glanced at your picture before reading, and I was able to correctly guess what everything meant before I went back and read your description. To me, that's a very good indicator that you've got a good visualization. However, one worry I have is overlap. In a real world setting, there are usually quite a few wireless networks to connect to in any one place, and even for a single network there are usually many access points, especially in buildings with multiple floors. This could potentially cause a lot of clutter and make reading the map difficult.
-
Where To Intern?
 Ariel Tian
Anna, great job on this project! You clearly explained how you connected to the readings we've had and how you've incorporated the new ideas we've learned about. My only concern is that the actual representation is not very intuitive. It is hard to know what exactly the inner circles and the color gradients mean, until we read your description. Is there any way you could make it clearer? Like adding a legend, for example?
-
"Everyone's Doing It"
Jacob SloneI really like the graphical representation you chose for this! One thing that I think could go a long way in really making this even better is if you could reorder the subcategories. For example, you have FPS > Valve > TF2 > PVP > Control Pit, it would be awesome if you could reorder it to something like PVP > Control Pit > FPS > Valve > TF2 to get a better idea of what types of games and game modes people like to play. Obviously this has issues as each game has slight variations, but there is a lot of cross over in these game types that would be interesting to visualize.
-
Television Trends
Ariel TianThis is a great idea, Eric! It is a lot more directed and succinct that the idea you originally had in class.
Here is my one suggestion: consider where you will display this data. Will it be an app that people can download? Perhaps this app will tell the user how their television intake compares to the national average? Or will this be an interactive screen in a museum? Answering these questions will make your project feel much more tangible.
-
Health Communication Map
Naomi SternsteinYou thought out your ideas very well, which I like. I think that because there is so much useful data to input, graph readability is very important.
One thing that I may not have understood correctly- is the symptoms graph a separate graph that also requires the input of data? And does the user add in their own symptoms (for example, tiredness or back pain) or do they come out naturally from what the user has inputed previously? I also wonder if there is a way to group together certain types of data and create tabs based on data that would be more important for certain illnesses, just in case the user might be discouraged from using the program because they do not want to have to input too much (people get lazy haha).
But overall- seeing the colors on the graphs really helped me visualize what we had discussed in class. -
Strange Interactions
Naomi SternsteinI really like the way in which you decided to collect the data- with pictures of people. I think you also did well to address the fact that sometimes the data will not create a single unique expression, and therefore will be "fuzzy", and that is ok. In what situations though do you see these pictures being taken? Approaching strangers on streets, or also in elevators? It also might be interesting to eventually break this down into more data- such as age, and gender, along with the location, and see if any trends arise from that.
-
"Everyone's Doing It"
Ariel TianI absolutely love what you have done; the graphical display is clean and simple, and you can really sell your idea. (The commercial reference in your title is also my all time favorite commercial, so great choice!)
The only thing I would suggest is to think about what you want to say about how much we play video games. Are you saying video games is a good source of interaction? Are you encouraging us to use video games as a means to communicate? And if so, how are you conveying that message with your display? I think you've done a wonderful job presenting the data, all that's left is to take a firm stance about it.
-
You've Got Mail
Ivan WangCurious idea! I've taken great pains to economize time on emails, and can definitely relate to your problem. While I like the idea of measuring time spent reading or writing emails, however, it might be useful to consider other factors (for example, number of unread emails-- a day where you receive 20 emails might affect reading times compared to one where you receive 3). I'd also suggest moving to a more connected data visualization (e.g. a streamgraph: http://bl.ocks.org/mbostock/4060954). Although perhaps harder to see data for a single day, it makes visualizing changes over time much easier (and is a bit more artistic too!)
-
Daily Motion
Ivan WangAs someone with posture problems, I really like this idea! While seeing an aggregate of points at the end of the day might help, however, it may not help at other times (I tend to slouch when I forget, until I'm explicitly reminded). One suggestion is to examine the data and find the times of day when one's posture is at its worst (or even allow the user to select these times). Perhaps you could work this into an app that flashes or beeps a reminder for the user to stand up straight again.
-
Bathroom Data
 Brian Walsh
This reminds me of those urinals in Japan that make a game out of peeing. The closer you pee to the bullseye, the higher your score! Of course, your project has a little more practical usage.
-
Play With Your Food
Brian WalshI like how you decided to transform it from being completely like the game of tetris, as that was too difficult. Now, keeping with the block representation, you can more easily see the data, and it really shows you when you're getting too close to that unwanted level of intake.
-
Wi-fi Waves
Brian WalshI like it. It is short, to the point, and expresses the usage and flow of wifi on campus in an intuitive way. Specifically, it utilizes colors that we often associate with "good", "bad", or "medium".
It would help, though, to know what exactly you would like to convey to the user on a deeper level if they do happen to click on a wi-fi spot
-
Strange Interactions
Tonya SedgwickI think this turned out well. My one question is this: do you mean for this project to be only in a physical gallery space, or could it also be adapted for an online version as well? It sort of reminds me of those things that roll around social media with a list of "30 pictures representing ____"
-
A Cup of Coffee: Bridging the Gap
Tonya SedgwickI like how this turned out. One question I have is: what kind of space would this sequence of installations exist in? Is it a theatre, in which the audience observes these things happening around them, and each different coffee ritual involves a set change? Is it a series of connected rooms that people can walk through? Is it a single long gallery, in which the audience members walk from one exhibit to the next?
Health Communication Map
Your feedback on your peers' projects is very helpful, and allows for some interesting food for thought on their projects. Great job!
Your project is also very interesting! There are so many things that could be useful about this project, and it is also something that can have instant emotional connections to the audience. Everyone has some relation to illness, and this could be something that connects people through a shared experience.
Some things to consider:
-- The informational part is very well thought out, and I think exploring how these things could potentially "connect" people would be an interesting study on the phenomenon of medical care in America, and other countries as well.